Grafana is a famous Open Source solution to observe graphs and logs, supporting many data sources.
This tutorial explains how to install Grafana on Qovery, and you will see how easy it is.
Grafana setup
First of all, create a project and an environment. Then let's create Grafana application.
Create a Grafana application
Connect to the console and add a new application:
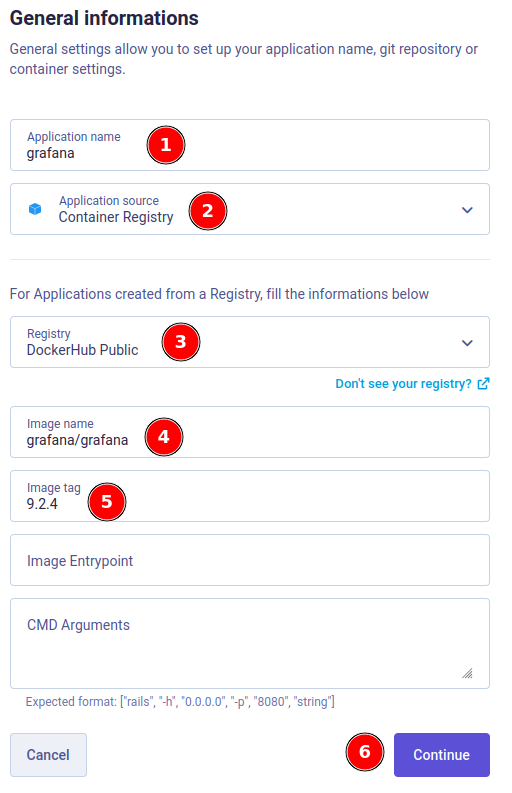
- Set an application name
- Select the application source type: Container registry
- Select DockerHub Public (or the one you have. If you do not have one, create a registry pointing to DockerHub)
- Set the image name: grafana/grafana
- Take a look at the latest Grafana tags and set the tag you want to use (do not use latest one to avoid later issues)
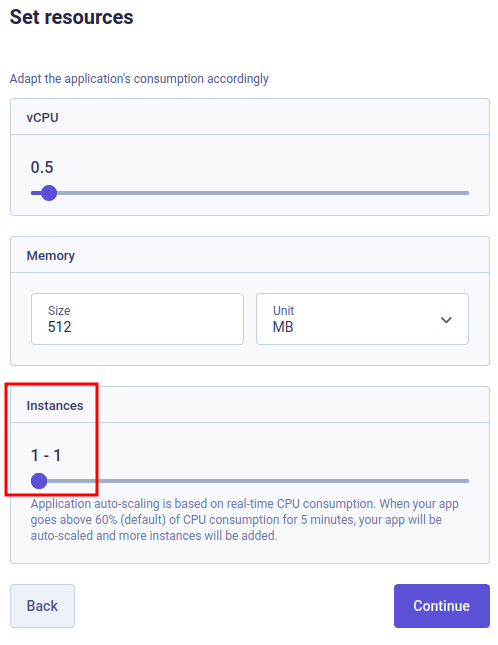
Then set the resources to 1 instance and let other default values (Grafana doesn't consume a lot of resources):
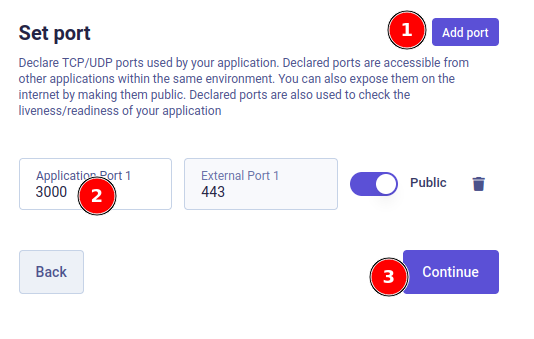
Add a port mapping to the application, and set it to 3000:
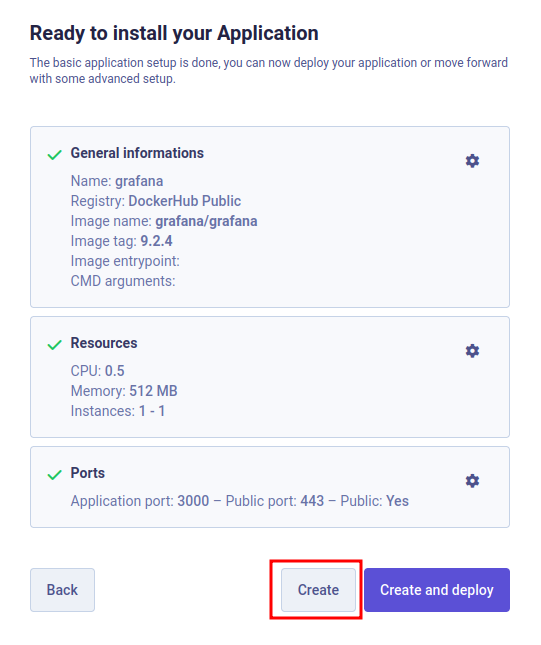
Finally, click on the Create button:
Configure database storage
We're now going to create a volume that will contain Grafana default database:
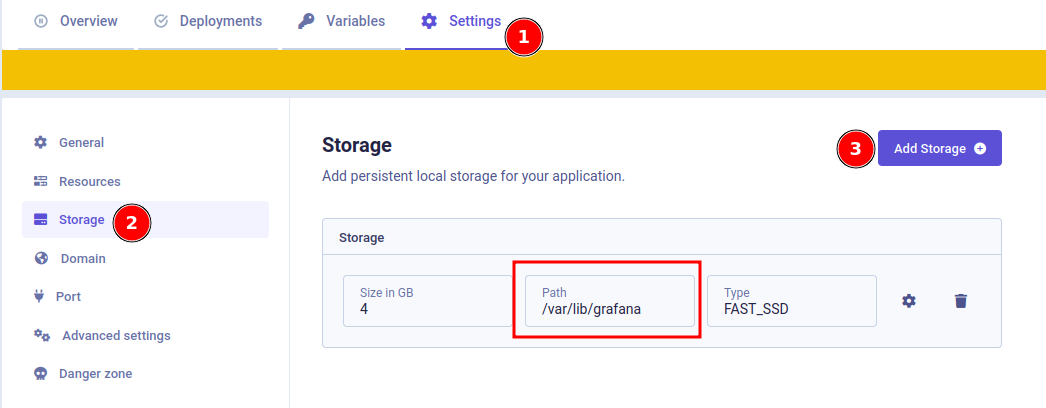
Go into Settings > Storage > Add Storage. Set the Path to /var/lib/grafana and the Size to 4Gi. Click on Create.
Usage
Now you can deploy Grafana :). On the top right, you have the Open links button which will help you to get quick access. Then connect with those credentials:
- Login: admin
- Password: admin
Cloudwatch Datasource
You can add several data sources to Grafana. One we recommend at Qovery for full-text search is Cloudwatch. First of all, you have to follow this guide to ensure all your logs are sent to Cloudwatch. Then, you can add a new data source in Grafana:
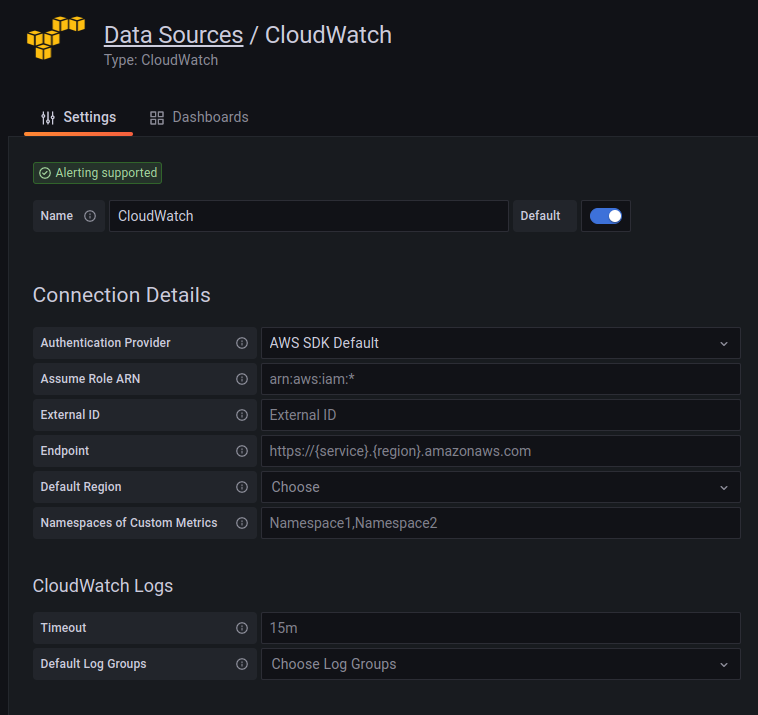
We advise you to use assume role or use a dedicated service account in read-only to access your logs. In this case, those permissions will be required:
{"Version": "2012-10-17","Statement": [{"Sid": "AllowReadingLogsFromCloudWatch","Effect": "Allow","Action": ["logs:DescribeLogGroups","logs:GetLogGroupFields","logs:StartQuery","logs:StopQuery","logs:GetQueryResults","logs:GetLogEvents"],"Resource": "*"},{"Sid": "AllowReadingTagsInstancesRegionsFromEC2","Effect": "Allow","Action": ["ec2:DescribeTags", "ec2:DescribeInstances", "ec2:DescribeRegions"],"Resource": "*"},{"Sid": "AllowReadingResourcesForTags","Effect": "Allow","Action": "tag:GetResources","Resource": "*"}]}
More info: https://grafana.com/docs/grafana/latest/datasources/aws-cloudwatch/
Once done, you're able to create dashboards using Cloudwatch datasource and perform queries to your logs.