Now that your service is up and running on Qovery, you might want to setup some rate limits to protect your service from abuse. While we usually recommend to do it via third parties like Cloudlfare or similar because using such solutions, the traffic will be filtered out before reaching your workload hence not wasting your resources. This guide will show you how to do that.
Before you begin, this guide assumes the following:
- Your app is running on a Qovery managed cluster.
Goal
This tutorial will cover how to setup rate limit on your services by customizing Nginx configuration. Several options are possible:
- Global rate limit
- Global rate limit per custom header
- Service level rate limit
- Customize request limit HTTP status code
- Limit connection number
Understand NGINX rate limiting configuration
More information about how rate limit works on NGINX can be found on their blog in this post.
Initial setup
Configure service
I will use a basic container service echo-server setup with Qovery. This service is listening on port 80.

To start with, this service don't have any rate limit set, so everything will be accepted.
For demonstration purpose: set nginx replicas to 1
For this tutorial and to ease the demonstration, I am setting nginx controller instances to 1 (min = max = 1) in cluster advanced settings. Please do not set this in production, as it will reduce the availability of your service.

Load testing
I will send couple requests against this service showing off there is no rate limit set (100 req/sec and 500 requests total).
❯ oha -q 100 -n 500 https://p8080-za845ce06-z01d340ed-gtw.z77ccfcb8.slab.sh/Summary:Success rate: 100.00%Total: 4.9964 secsSlowest: 0.0275 secsFastest: 0.0029 secsAverage: 0.0052 secsRequests/sec: 100.0720Total data: 229.00 KiBSize/request: 469 BSize/sec: 45.83 KiBResponse time histogram:0.003 [1] |0.005 [432] |■■■■■■■■■■■■■■■■■■■■■■■■■■■■■■■■0.008 [14] |■0.010 [1] |0.013 [2] |0.015 [2] |0.018 [39] |■■0.020 [4] |0.023 [1] |0.025 [3] |0.028 [1] |Response time distribution:10.00% in 0.0032 secs25.00% in 0.0034 secs50.00% in 0.0038 secs75.00% in 0.0043 secs90.00% in 0.0150 secs95.00% in 0.0163 secs99.00% in 0.0211 secs99.90% in 0.0275 secs99.99% in 0.0275 secsDetails (average, fastest, slowest):DNS+dialup: 0.0126 secs, 0.0115 secs, 0.0172 secsDNS-lookup: 0.0001 secs, 0.0000 secs, 0.0003 secsStatus code distribution:[200] 500 responsesAs we can see, all requests ended up with
200status code.
Global rate limit
Setting a global rate limit that affects all matching requests from each IP address is useful for protecting your server from abuse while allowing legitimate traffic through. This setting will set a global rate limit to all exposed services on the cluster.
Declare the global rate at cluster level
In order to set a global rate limit, we need to declare it at cluster level in cluster advanced settings
nginx.controller.http_snippet(see documentation).Here's nginx
nginx.controller.http_snippetvalue we will set:Detailslimit_req_zone "$server_name" zone=global:10m rate=10r/s;limit_req_zone: this is the NGINX directive that defines a shared memory zone for rate limiting"$server_name": could be replaced with any constant value like"1", the key just needs to be the same for all requests. You can also use$http_x_forwarded_forto rate limit based on the client IP address or any other custom headers, see custom rate limit keyzone=global:10m:globalis the name of the zone (you'll reference this name in your location blocks),10mallocates 10 megabytes of shared memory for storing rate limiting statesrate=100r/s: allows 100 requests per second, any requests above this rate will be delayed or rejected.
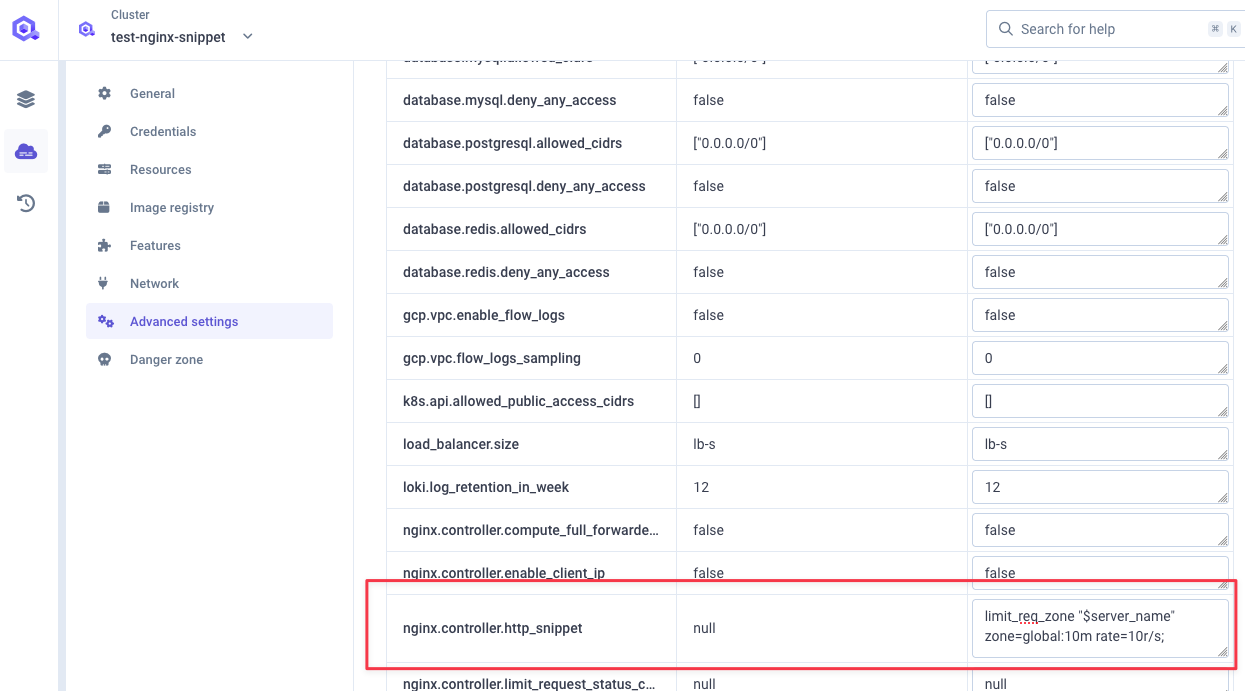
Use this global rate
Now that our global rate is defined, let use it in our nginx configuration.
In order to do so, we need to declare this server snippet at cluster level in advanced setting
nginx.controller.server_snippet(see documentation):Detailslocation / {limit_req zone=global;}location /: matches all HTTP requests to your server (the / path is the root and matches everything)limit_req zone=global: applies the rate limiting rules from the zone named"global"that we defined earlier. By default with this basic syntax, it will: not allow any bursting, reject excess requests with a 503 error, use"leaky bucket"algorithm for request processing
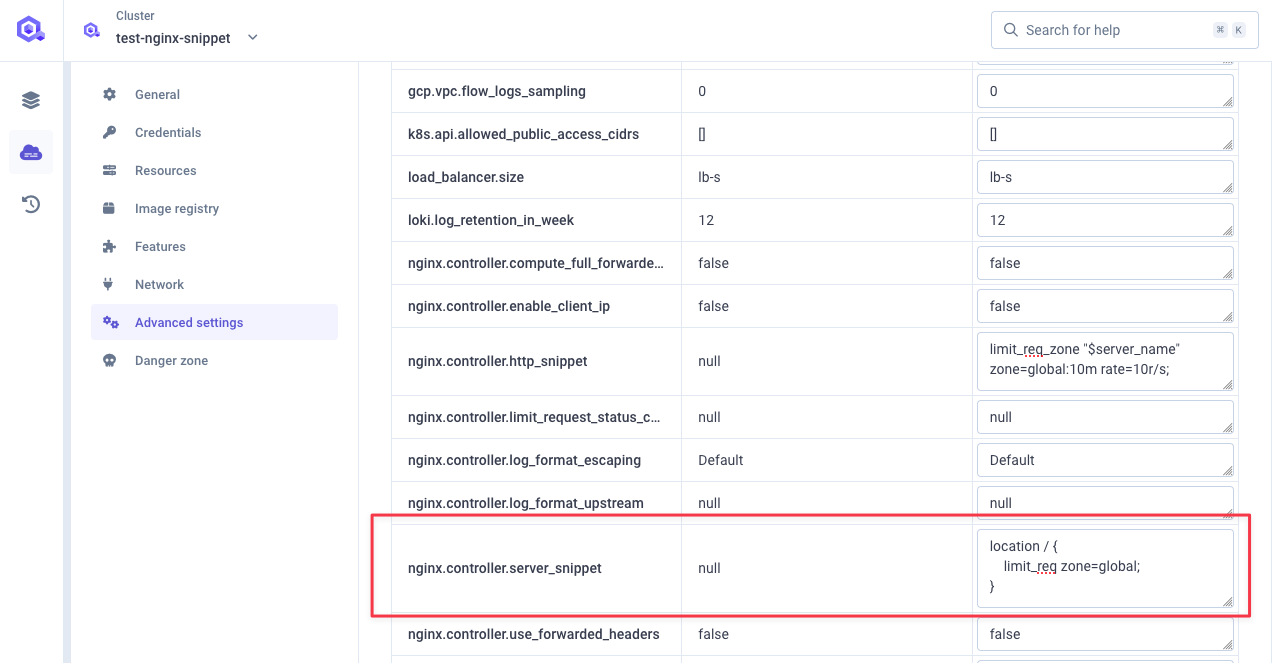
Deploy your cluster
You can now deploy your cluster with the new settings.
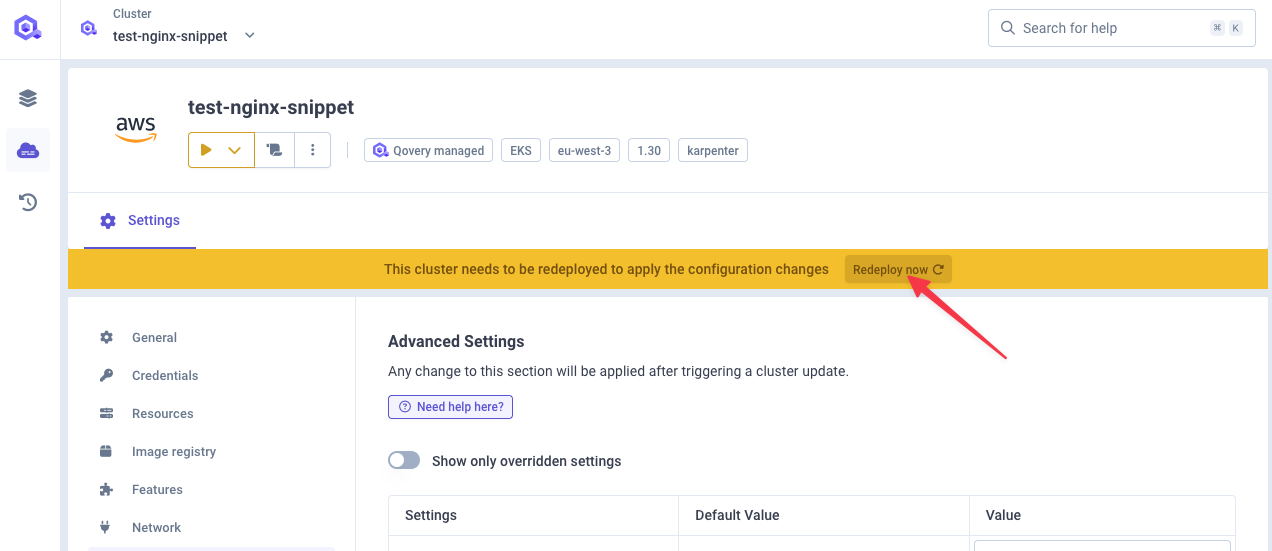
Testing the global rate limit
Let's test our setup, by sending 100 requests per second for 500 requests total. We should see that some requests are rejected with a 503 status code.
❯ oha -q 100 -n 500 https://p8080-za845ce06-z01d340ed-gtw.z77ccfcb8.slab.sh/ohaSummary:Success rate: 100.00%Total: 4.9966 secsSlowest: 0.0405 secsFastest: 0.0024 secsAverage: 0.0049 secsRequests/sec: 100.0674Total data: 105.85 KiBSize/request: 216 BSize/sec: 21.18 KiBResponse time histogram:0.002 [1] |0.006 [439] |■■■■■■■■■■■■■■■■■■■■■■■■■■■■■■■■0.010 [8] |0.014 [0] |0.018 [35] |■■0.021 [7] |0.025 [5] |0.029 [3] |0.033 [0] |0.037 [1] |0.041 [1] |Response time distribution:10.00% in 0.0028 secs25.00% in 0.0030 secs50.00% in 0.0032 secs75.00% in 0.0035 secs90.00% in 0.0145 secs95.00% in 0.0167 secs99.00% in 0.0253 secs99.90% in 0.0405 secs99.99% in 0.0405 secsDetails (average, fastest, slowest):DNS+dialup: 0.0141 secs, 0.0113 secs, 0.0264 secsDNS-lookup: 0.0000 secs, 0.0000 secs, 0.0005 secsStatus code distribution:[503] 452 responses[200] 48 responsesWe do see a total of 500 requests sent over 5 seconds (100 req/sec) with 452 requests rejected with a
503status code. Doing the maths 48 requests were accepted with200status code (48 / 5 = 9.6 req/sec) which matches the limit we set: 10 req/sec.One quick look at NGINX logs in our service logs, we can see a message for those rejected requests:
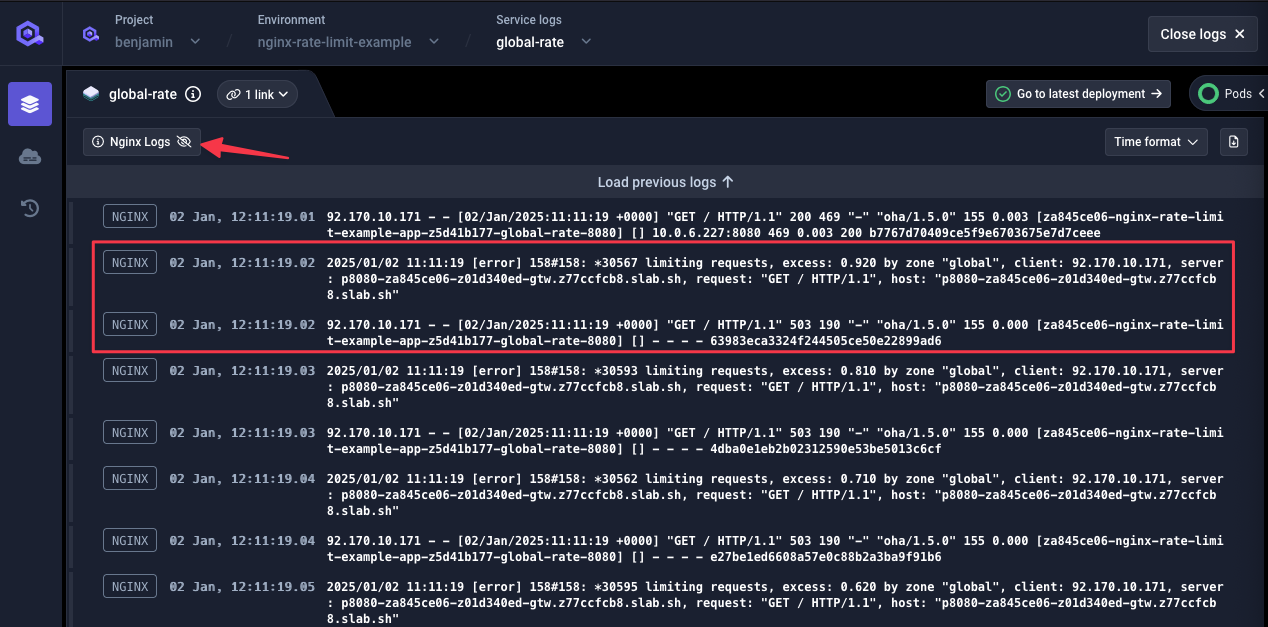
Service level rate limit
You can also set rate limits at the service level, which can be useful if you want to have different rate limits for different services.
The configuration described below will limit the number of requests per second from an IP address (it's not global to the service).
Set rate limit in service advanced settings
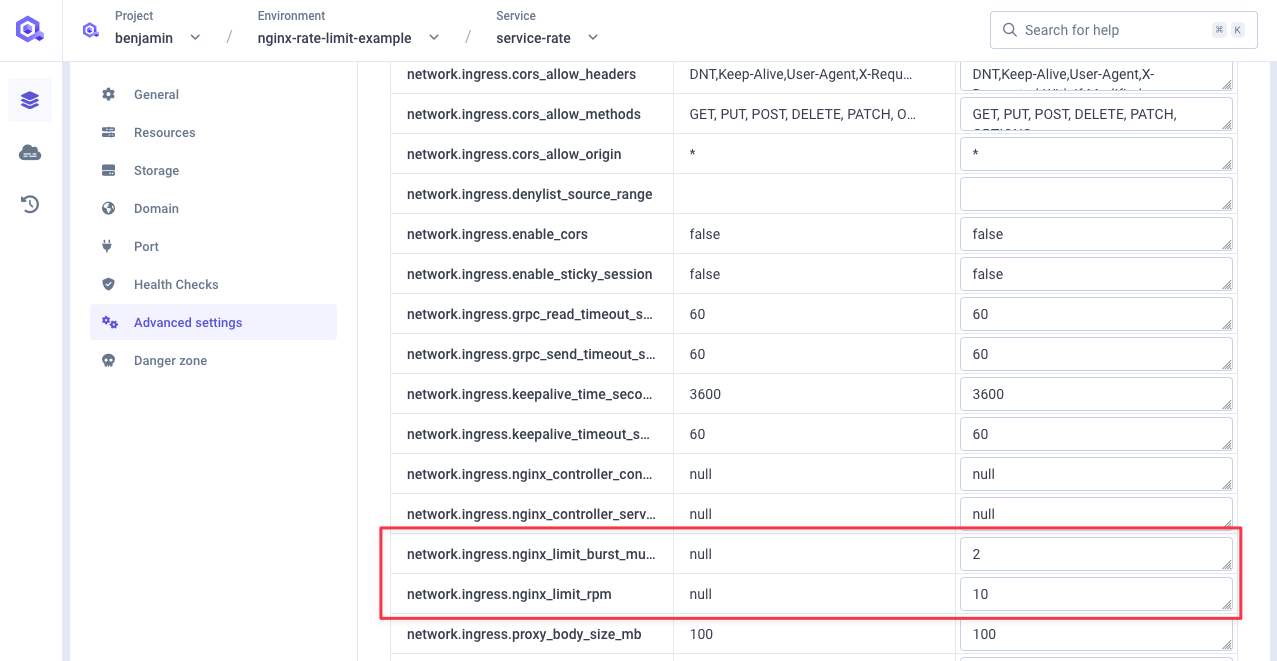
Go to your service advanced settings and set those two settings:
network.ingress.nginx_limit_rps: the rate limit in requests per second you want to set for your service (see documentation)network.ingress.nginx_limit_rpm: the rate limit in requests per minute you want to set for your service (see documentation)network.ingress.nginx_limit_burst_multiplier: the burst limit multiplier in requests for your service (default is 5) (see documentation)
For this example, I will set a rate limit of 10 requests per minute with a burst limit of 2x.
Using those
Deploy your service
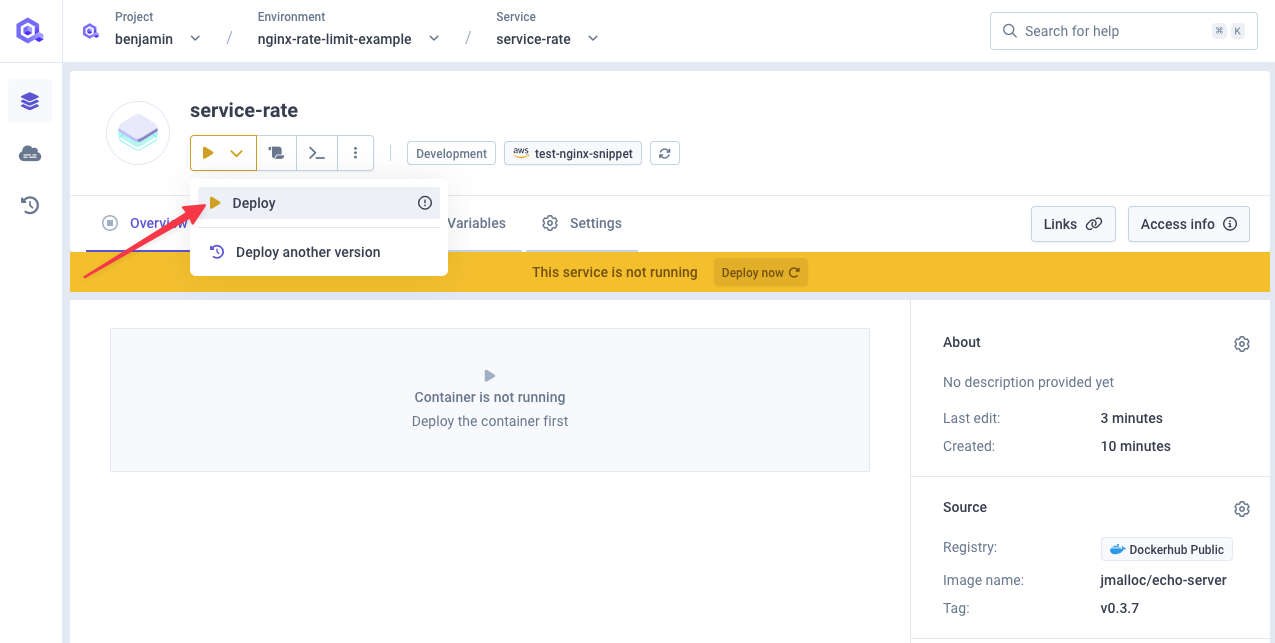
Deploy your service with the new settings.
Testing the service level rate limit
Let's test our setup, by sending 100 requests per second for 500 requests total. We should see that some requests are rejected with a 503 status code.
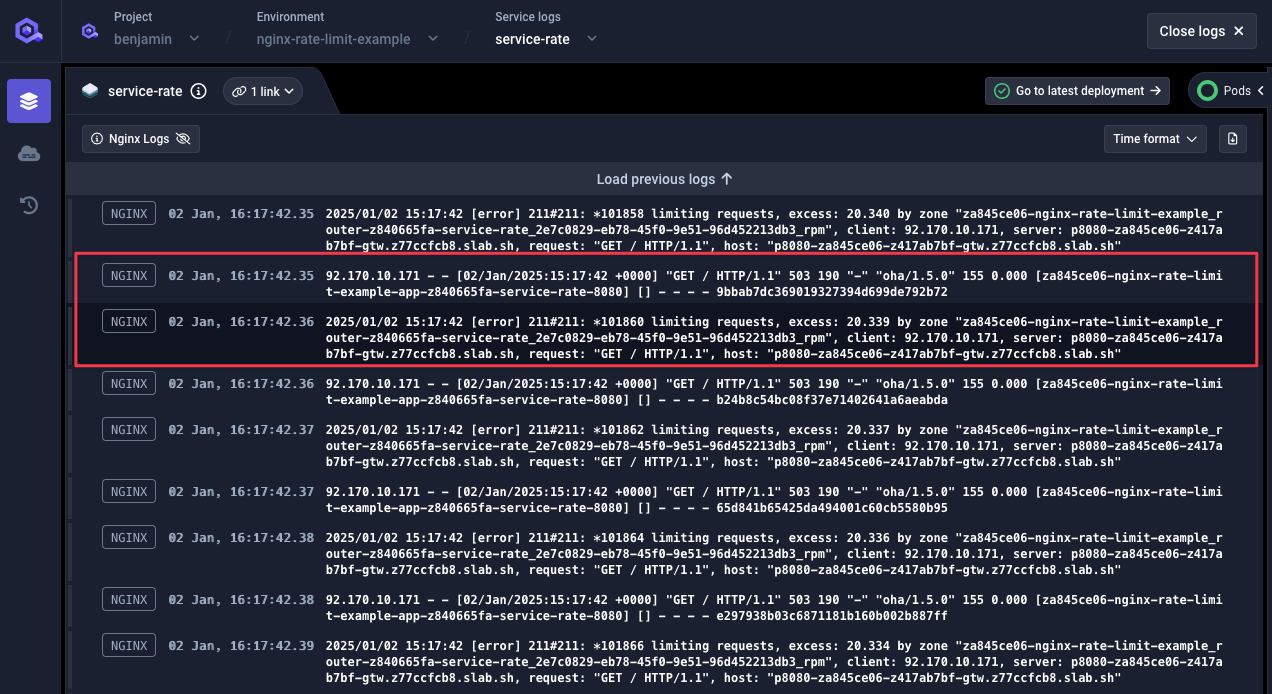
❯ oha -q 100 -n 500 https://p8080-za845ce06-z417ab7bf-gtw.z77ccfcb8.slab.sh/ohaSummary:Success rate: 100.00%Total: 5.0009 secsSlowest: 0.0705 secsFastest: 0.0025 secsAverage: 0.0062 secsRequests/sec: 99.9827Total data: 98.52 KiBSize/request: 201 BSize/sec: 19.70 KiBResponse time histogram:0.002 [1] |0.009 [449] |■■■■■■■■■■■■■■■■■■■■■■■■■■■■■■■■0.016 [5] |0.023 [12] |0.030 [11] |0.036 [5] |0.043 [4] |0.050 [6] |0.057 [2] |0.064 [4] |0.070 [1] |Response time distribution:10.00% in 0.0029 secs25.00% in 0.0031 secs50.00% in 0.0033 secs75.00% in 0.0037 secs90.00% in 0.0145 secs95.00% in 0.0263 secs99.00% in 0.0578 secs99.90% in 0.0705 secs99.99% in 0.0705 secsDetails (average, fastest, slowest):DNS+dialup: 0.0223 secs, 0.0114 secs, 0.0511 secsDNS-lookup: 0.0000 secs, 0.0000 secs, 0.0001 secsStatus code distribution:[503] 479 responses[200] 21 responsesWe do see a total of 500 requests sent over 5 seconds (100 req/sec) with 479 requests rejected with a
503status code. Doing the maths 21 requests were accepted with200status code which matches the limit we set: 10 req/min with x2 burst multiplier.One quick look at NGINX logs in our service logs, we can see a message for those rejected requests:
When you set both
network.ingress. nginx_limit_rpm(rate per minute) andnetwork.ingress. nginx_limit_rps(rate per second) annotations on an Nginx ingress, both rate limits will be enforced simultaneously. This means that traffic will be restricted based on whichever limit is hit first. For example, if you set:network.ingress.nginx_limit_rpm: 300network.ingress.nginx_limit_rps: 10
This configuration would mean:
- No more than 300 requests allowed per minute
- No more than 10 requests allowed per second
In practice, the
network.ingress. nginx_limit_rpsoften becomes the more restrictive limit. In the example above, whilenetwork.ingress. nginx_limit_rpmallows for 300 requests per minute (averaging to 5 requests per second), thenetwork.ingress. nginx_limit_rpssetting would block any burst over 10 requests in a single second, even if the total requests per minute is well below 300.
Service rate limit per custom header
So far, we've created rate limit on server name or client address IP, but you can also create rate limit based on custom headers.
This configuration requires to declare a rate limit at cluster level and then update service configurartion to use it.
Define this rate limiter
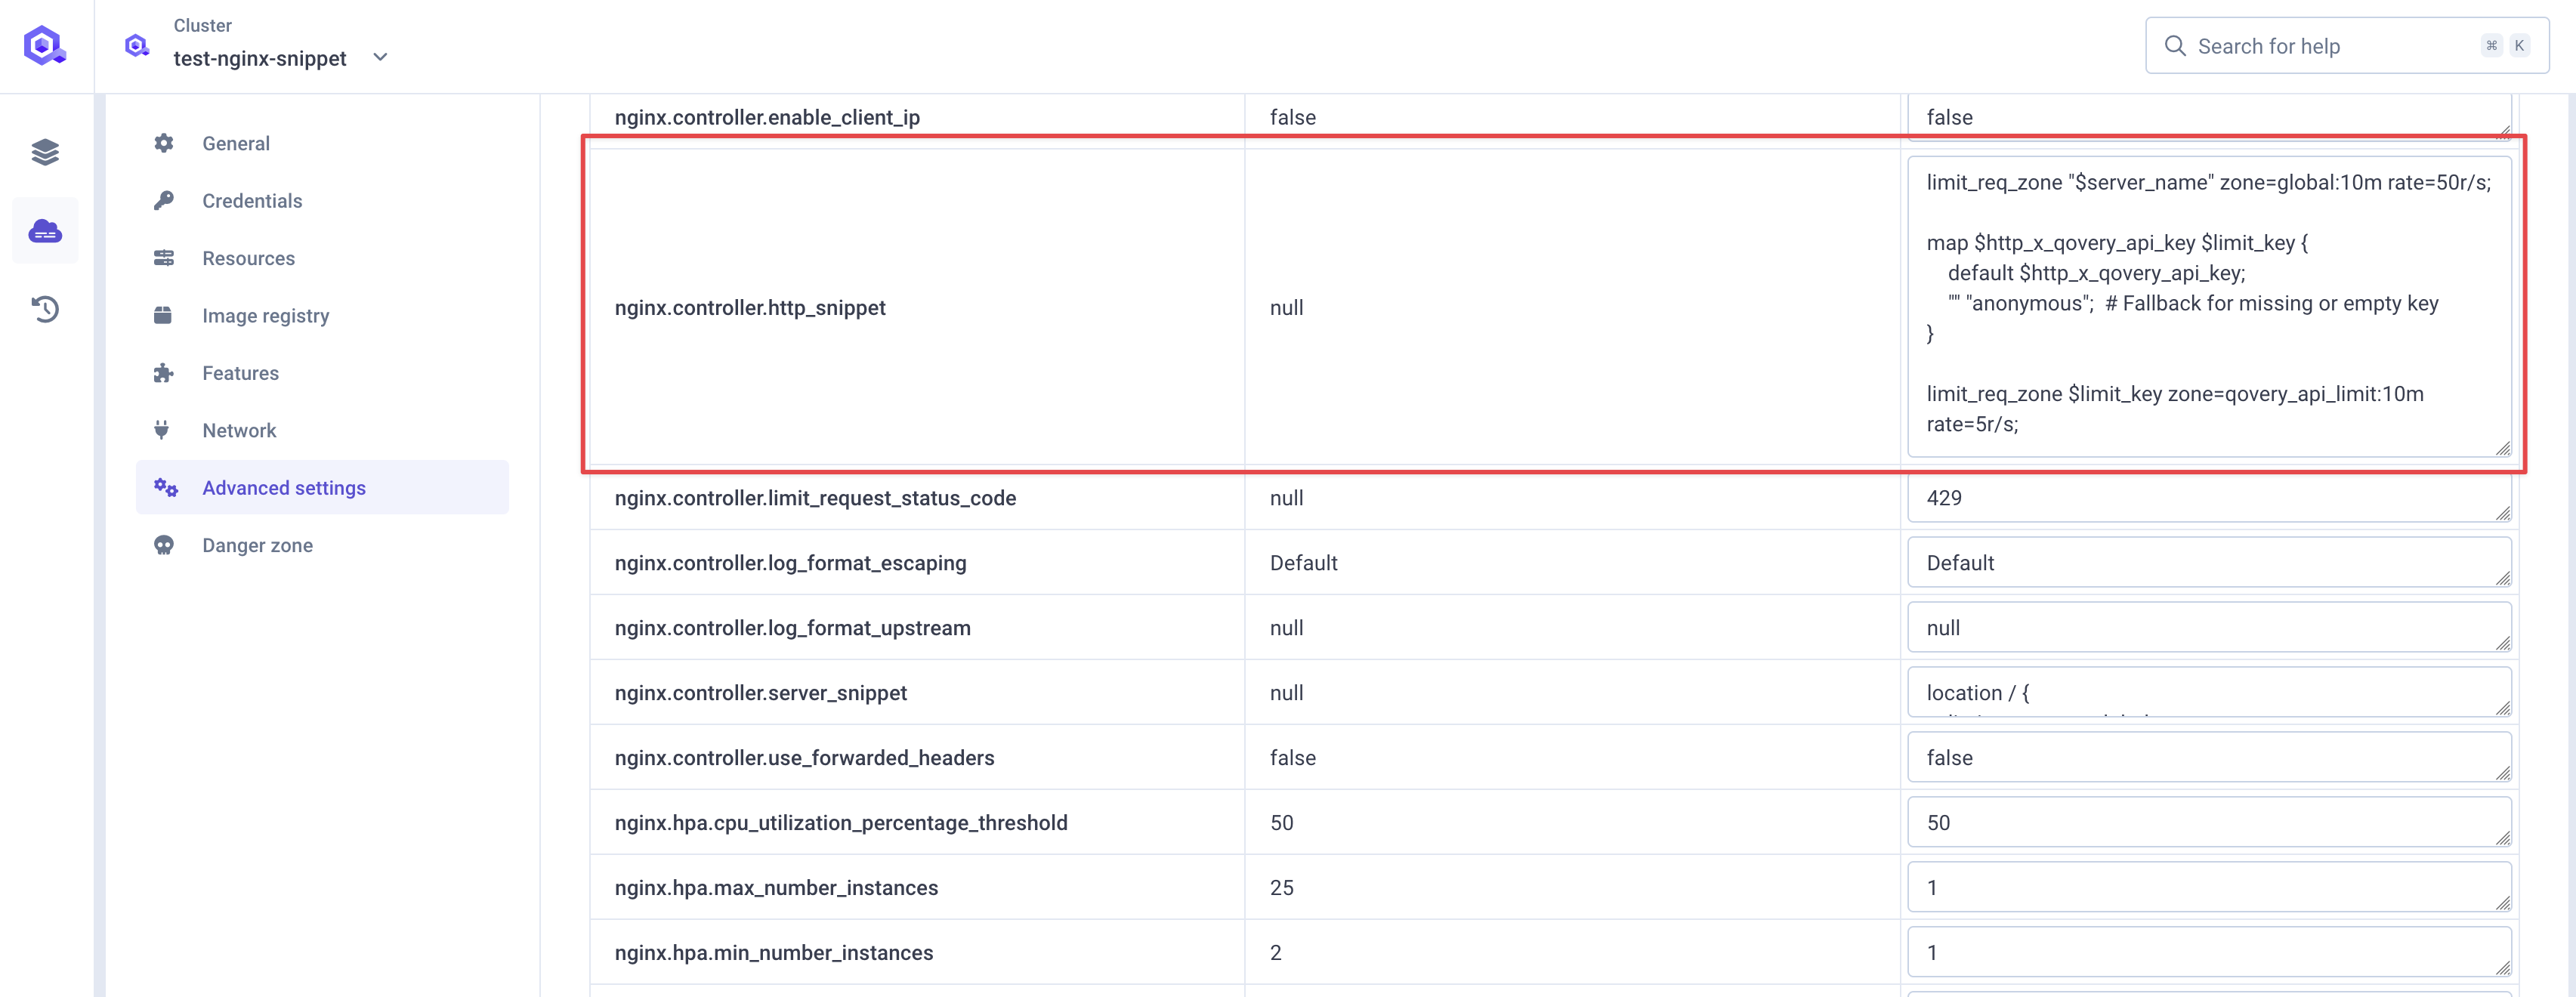
Go to cluster advanced settings, and declare this new rate limiter by setting
nginx.controller.http_snippet(see documentation) with the following value (if any configuration is already set as in the example below, you can just append it at the end):Details - `map`: directive creates a variable `$limit_key` based on the value of the `$http_x_qovery_api_key` header - `$http_x_qovery_api_key`: is the incoming HTTP header that contains the API key for the client making the requestmap $http_x_qovery_api_key $limit_key {default $http_x_qovery_api_key;"" "anonymous"; # Fallback for missing or empty key}limit_req_zone $limit_key zone=qovery_api_limit:10m rate=5r/s;If
$http_x_qovery_api_keyis present and non-empty,$limit_keywill be set to the value of$http_x_qovery_api_key. If$http_x_qovery_api_keyis missing or empty (""),$limit_keyis set to"anonymous".This ensures that requests without an API key are handled differently (e.g., rate-limited as anonymous users).
Make use of this rate limiter at service level
Go to your service advanced settings and set
network.ingress.nginx_controller_configuration_snippetwith the following:limit_req zone=qovery_api_limit burst=2 nodelay;In this example, we have set a burst of
2but it's not mandatory, you can set it to fit best to your use case (checkout this documentation chapterHandling burststo understand better burst). It allows a small burst of requests beyond the defined rate before enforcing the rate limit. Normally, therate=5r/ssetting in thelimit_req_zoneconfiguration allows up to 5 requests per second per$limit_key.burst=2setting allows up to 2 extra requests to pass through immediately, even if the rate limit has been exceeded, but only for short bursts.- `nodelay`` disables queuing of excess requests, without nodelay, excess requests would be queued and served later, respecting the rate limit.

Deploy your service
Deploy your service with the new settings.
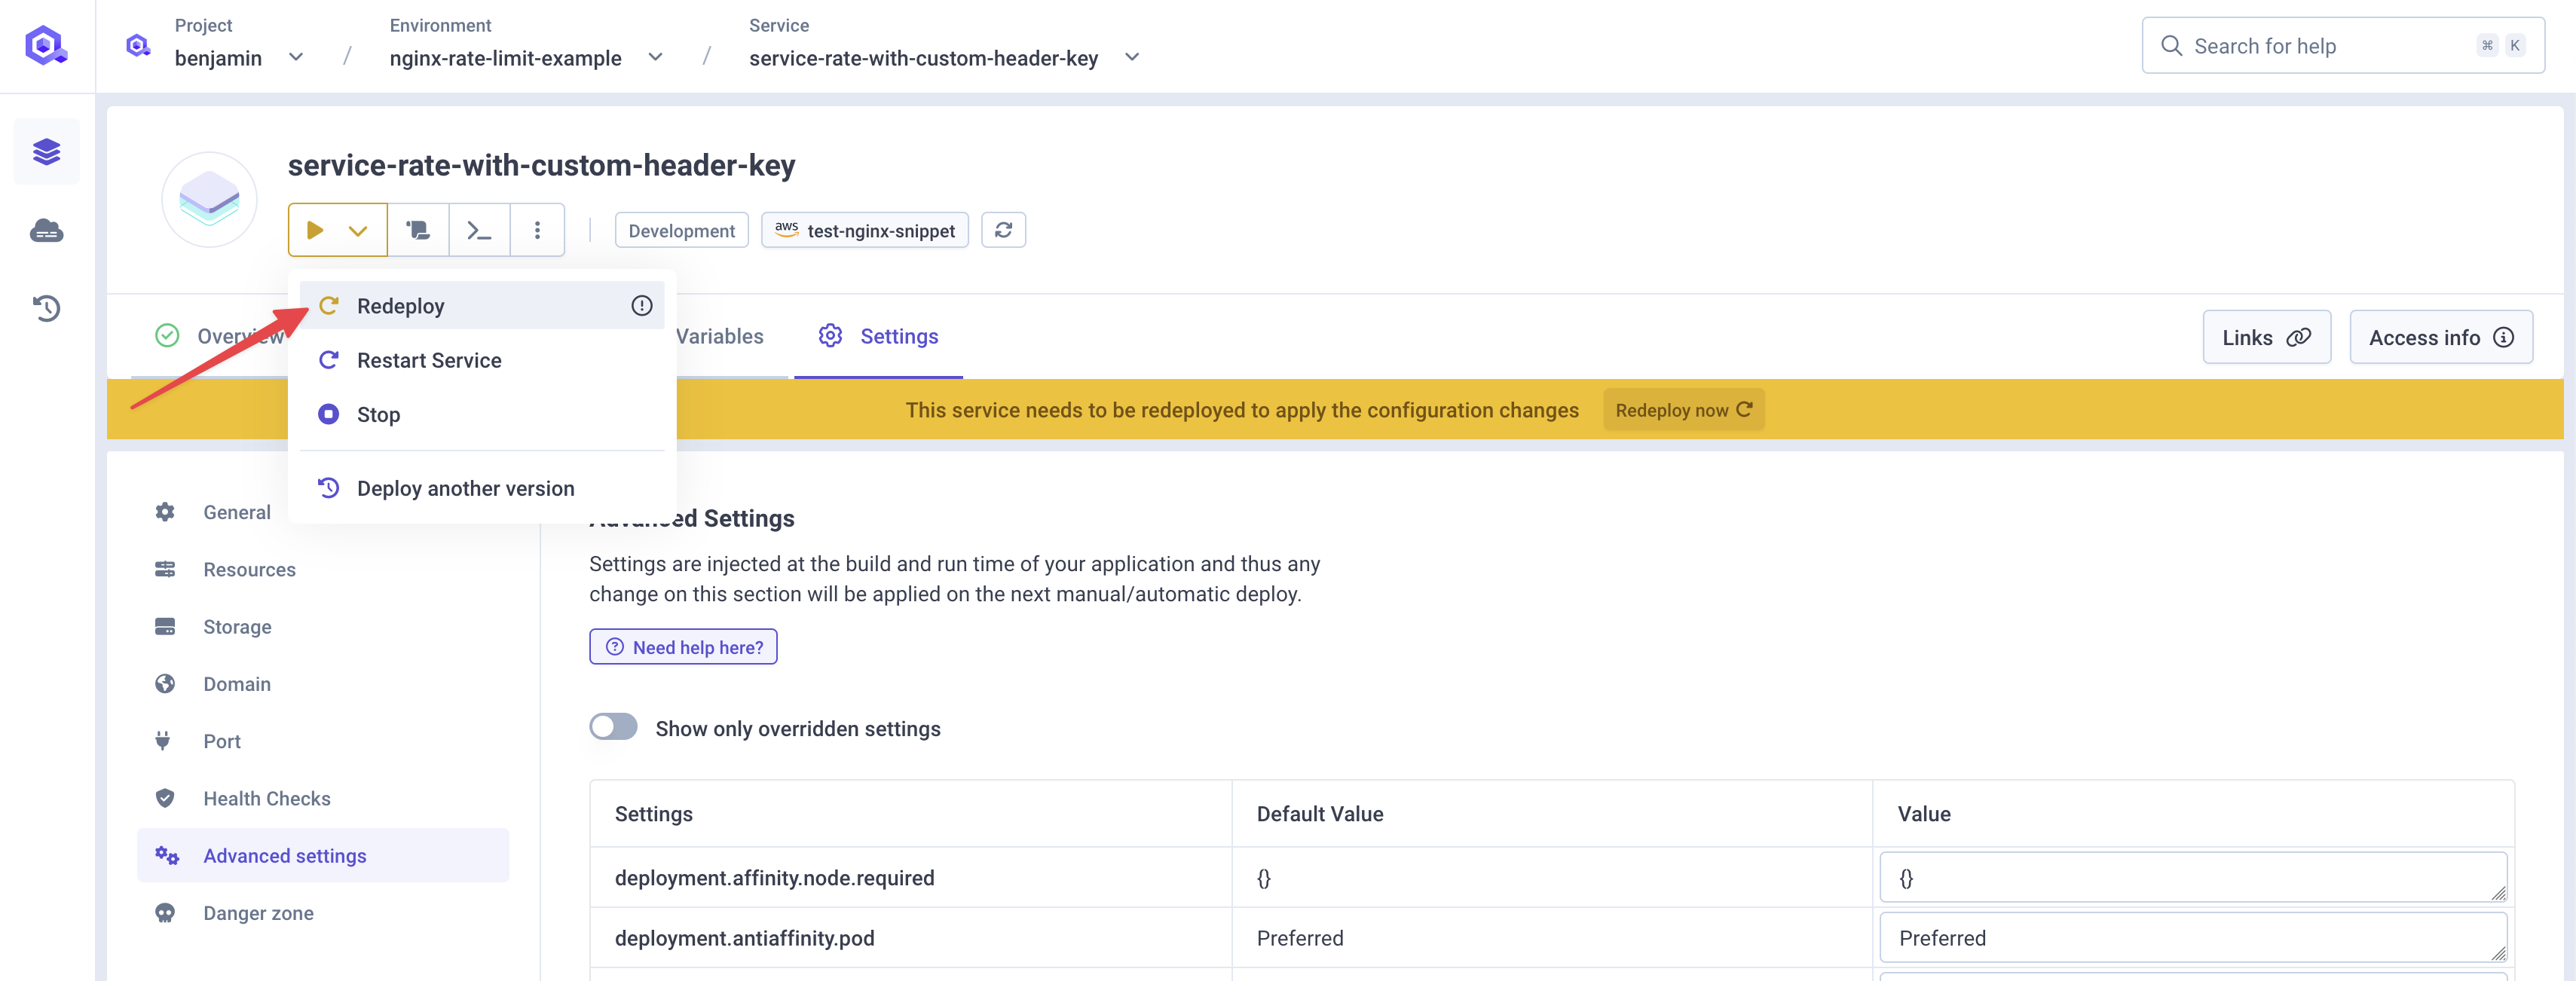
Testing the service level rate limit
Let's test our setup, by sending 100 requests per second for 500 requests total. We should see that some requests are rejected with a 503 status code.
❯ oha -q 100 -n 500 -H "X-QOVERY-API-KEY: benjamin" https://p8080-za845ce06-z82b5bc64-gtw.z77ccfcb8.slab.sh/Summary:Success rate: 100.00%Total: 4.9952 secsSlowest: 0.0474 secsFastest: 0.0025 secsAverage: 0.0050 secsRequests/sec: 100.0959Total data: 101.40 KiBSize/request: 207 BSize/sec: 20.30 KiBResponse time histogram:0.002 [1] |0.007 [447] |■■■■■■■■■■■■■■■■■■■■■■■■■■■■■■■■0.011 [2] |0.016 [12] |0.020 [23] |■0.025 [4] |0.029 [6] |0.034 [3] |0.038 [0] |0.043 [1] |0.047 [1] |Response time distribution:10.00% in 0.0028 secs25.00% in 0.0031 secs50.00% in 0.0032 secs75.00% in 0.0036 secs90.00% in 0.0147 secs95.00% in 0.0183 secs99.00% in 0.0310 secs99.90% in 0.0474 secs99.99% in 0.0474 secsDetails (average, fastest, slowest):DNS+dialup: 0.0160 secs, 0.0117 secs, 0.0338 secsDNS-lookup: 0.0000 secs, 0.0000 secs, 0.0001 secsStatus code distribution:[503] 473 responses[200] 27 responsesWe do see a total of 500 requests sent over 5 seconds (100 req/sec) with 473 requests rejected with a
503status code. Doing the maths 27 requests were accepted with200status code which matches the limit we set: 5.4 req/seq with two requests burst.One quick look at NGINX logs in our service logs, we can see a message for those rejected requests:
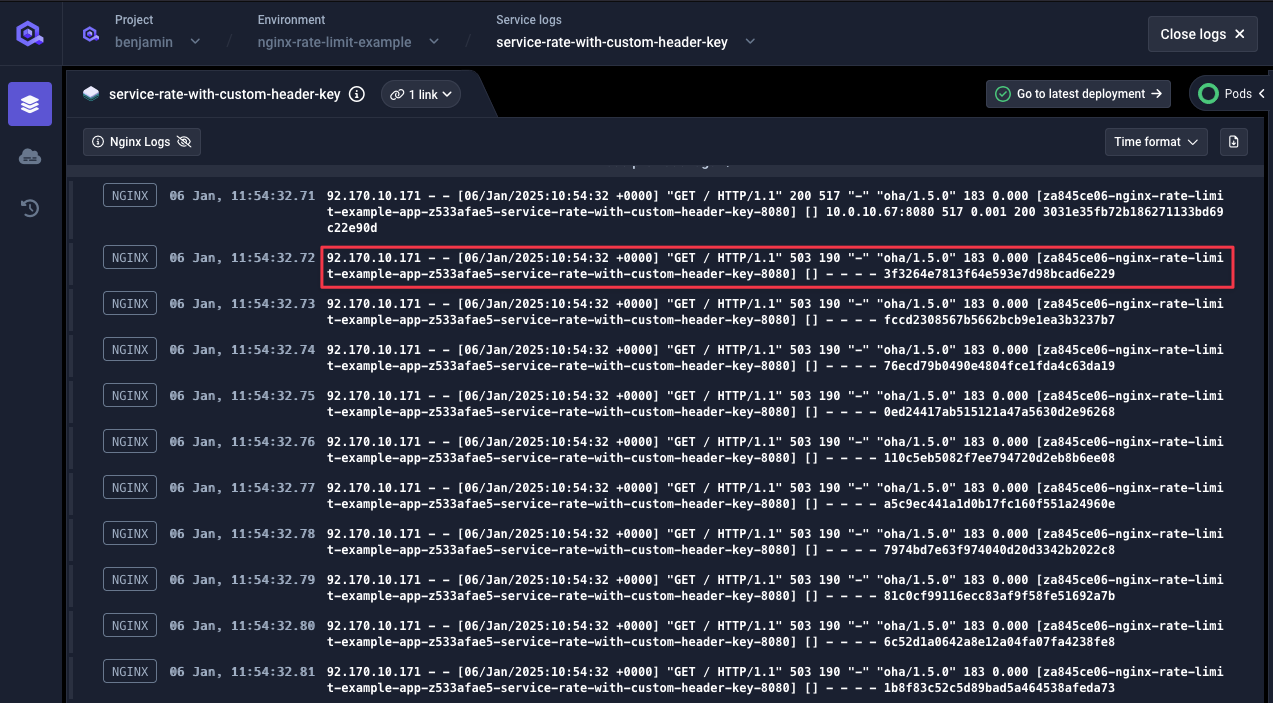
Looking at raw NGINX logs, we do see the name of the rate limiter rejecting those requests:

Other configuration examples
In this section, you will find couple other configurations examples (non exhaustive) you can set.
Custom request limit status HTTP code
While NGINX defaults to 503 HTTP Status code when rejecting requests, you can change this default by setting nginx.controller.limit_request_status_code in cluster advanced settings.
For example, we usually use 429.
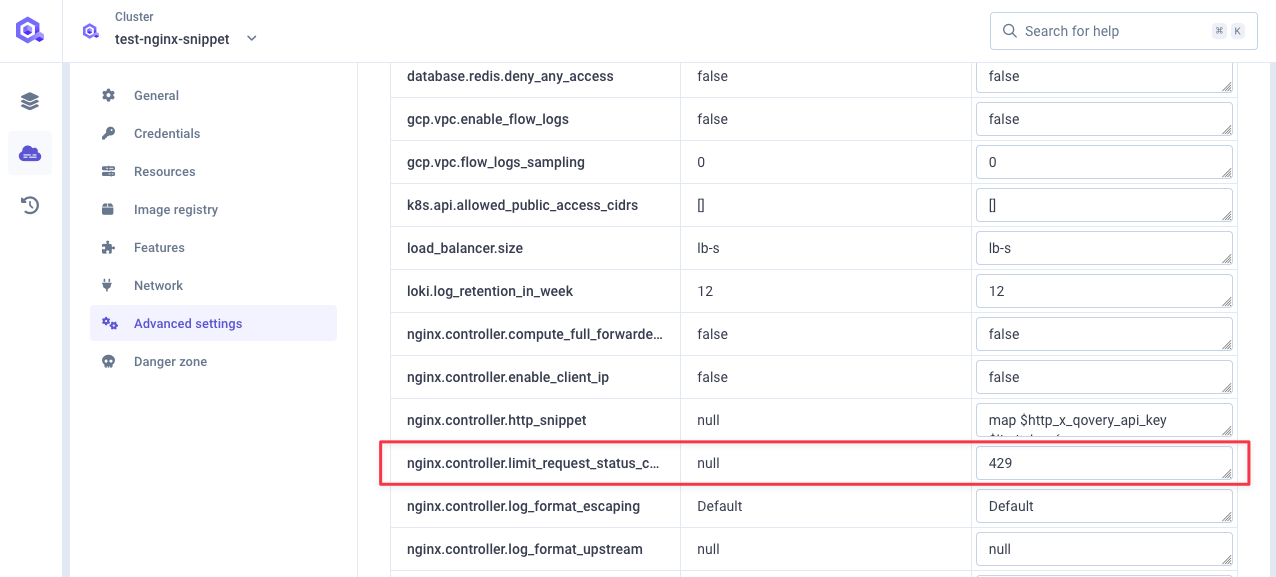
For any rate limited request, NGINX will now returns an HTTP 429 status code.
oha -q 100 -n 500 -H "X-QOVERY-API-KEY: benjamin" https://p8080-za845ce06-z82b5bc64-gtw.z77ccfcb8.slab.sh/Summary:Success rate: 100.00%Total: 5.0001 secsSlowest: 0.0616 secsFastest: 0.0052 secsAverage: 0.0102 secsRequests/sec: 99.9981Total data: 88.46 KiBSize/request: 181 BSize/sec: 17.69 KiBResponse time histogram:0.005 [1] |0.011 [438] |■■■■■■■■■■■■■■■■■■■■■■■■■■■■■■■■0.017 [10] |0.022 [1] |0.028 [0] |0.033 [15] |■0.039 [21] |■0.045 [4] |0.050 [6] |0.056 [1] |0.062 [3] |Response time distribution:10.00% in 0.0062 secs25.00% in 0.0065 secs50.00% in 0.0069 secs75.00% in 0.0076 secs90.00% in 0.0278 secs95.00% in 0.0353 secs99.00% in 0.0501 secs99.90% in 0.0616 secs99.99% in 0.0616 secsDetails (average, fastest, slowest):DNS+dialup: 0.0282 secs, 0.0206 secs, 0.0537 secsDNS-lookup: 0.0000 secs, 0.0000 secs, 0.0001 secsStatus code distribution:[429] 473 responses[200] 27 responses
We can see 429 status code returned, same goes when looking at NGINX logs:

Limit connections
You might want to limit the number of concurrent connections allowed from a single IP address.
To do so, you can set the network.ingress.nginx_limit_connections advanced setting at service level.