Your application is running, but something goes wrong? In this guide, you'll learn how to debug your application and solve your problem to make it running smoothly.
Before you begin, this page assumes the following:
- You have already deployed an application with Qovery
Your application is running, but for some reason, it is not working as expected. Here are a few tips to find out what's going on.
Check the status of your app
Qovery expose in the interface the running status of your application which provides you some highlevel information of its healthiness. You can look in this section to know more about the Running Status
If the service crashes, its Running Status will be displayed as a red dot. If that's the case, you can have a look at the logs to investigate the reason behind.
Live Logs
If you need to see the log output of your application while it's running, qovery expose them to you in real-time thanks to the Logs interface. You can have a look at this section to know more.
You can use this information to find out what causes your application to behave incorrectly.
Deployment Logs
If your application fails to start, you can check what's the cause in its deployment logs. You can have a look at this section to have more information on the deployment logs and how to access them.
This view provides insight into the build and deployment process. If anything goes wrong, you can see all the required information to fix the problem here.
You can check the Troubleshoot section to investigate any issue you might encounter during the deployment of your services.
Monitoring
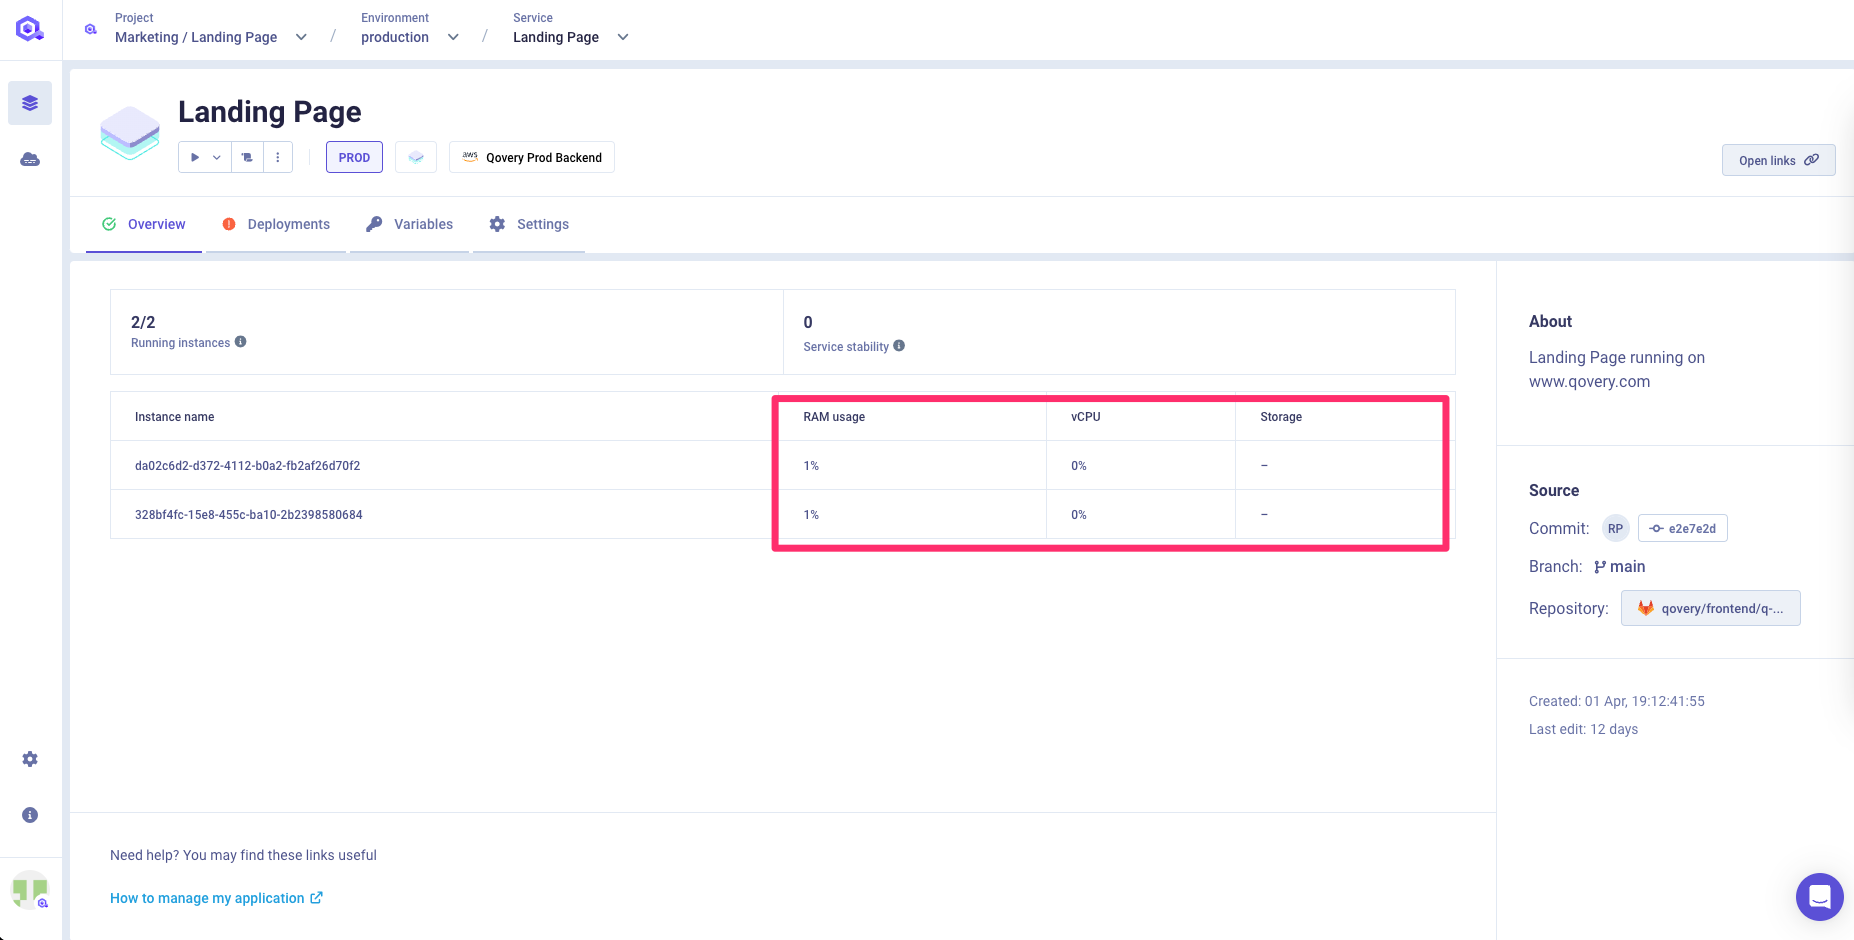
If you need more information about the resources consumed by your application, Qovery provides basic metrics about your CPU, memory and storage usage.
Navigate to Console
Choose your project, environment, and application.
In the main application view, you can see a table with the current application resource consumption.
Alerting
We highly recommend using tools like Datadog, Sentry or NewRelic to manage your alerting. Qovery will provide easy integrations in the coming release. Check out our roadmap
Do you need any help? Reach us on our forum