Logs
The Logs interface allows you to access:
- The deployment logs: every time a deployment is triggered, Qovery provides you with the log of its execution and as well with any error that might occur.
- The live logs of your applications: Qovery allows you to retrieve the logs of your application in real-time, streamed directly from your remote application (no data is stored on Qovery side). The logs are accessible as long as the application is running and writing the logs in the
stdout.
How to access the logs
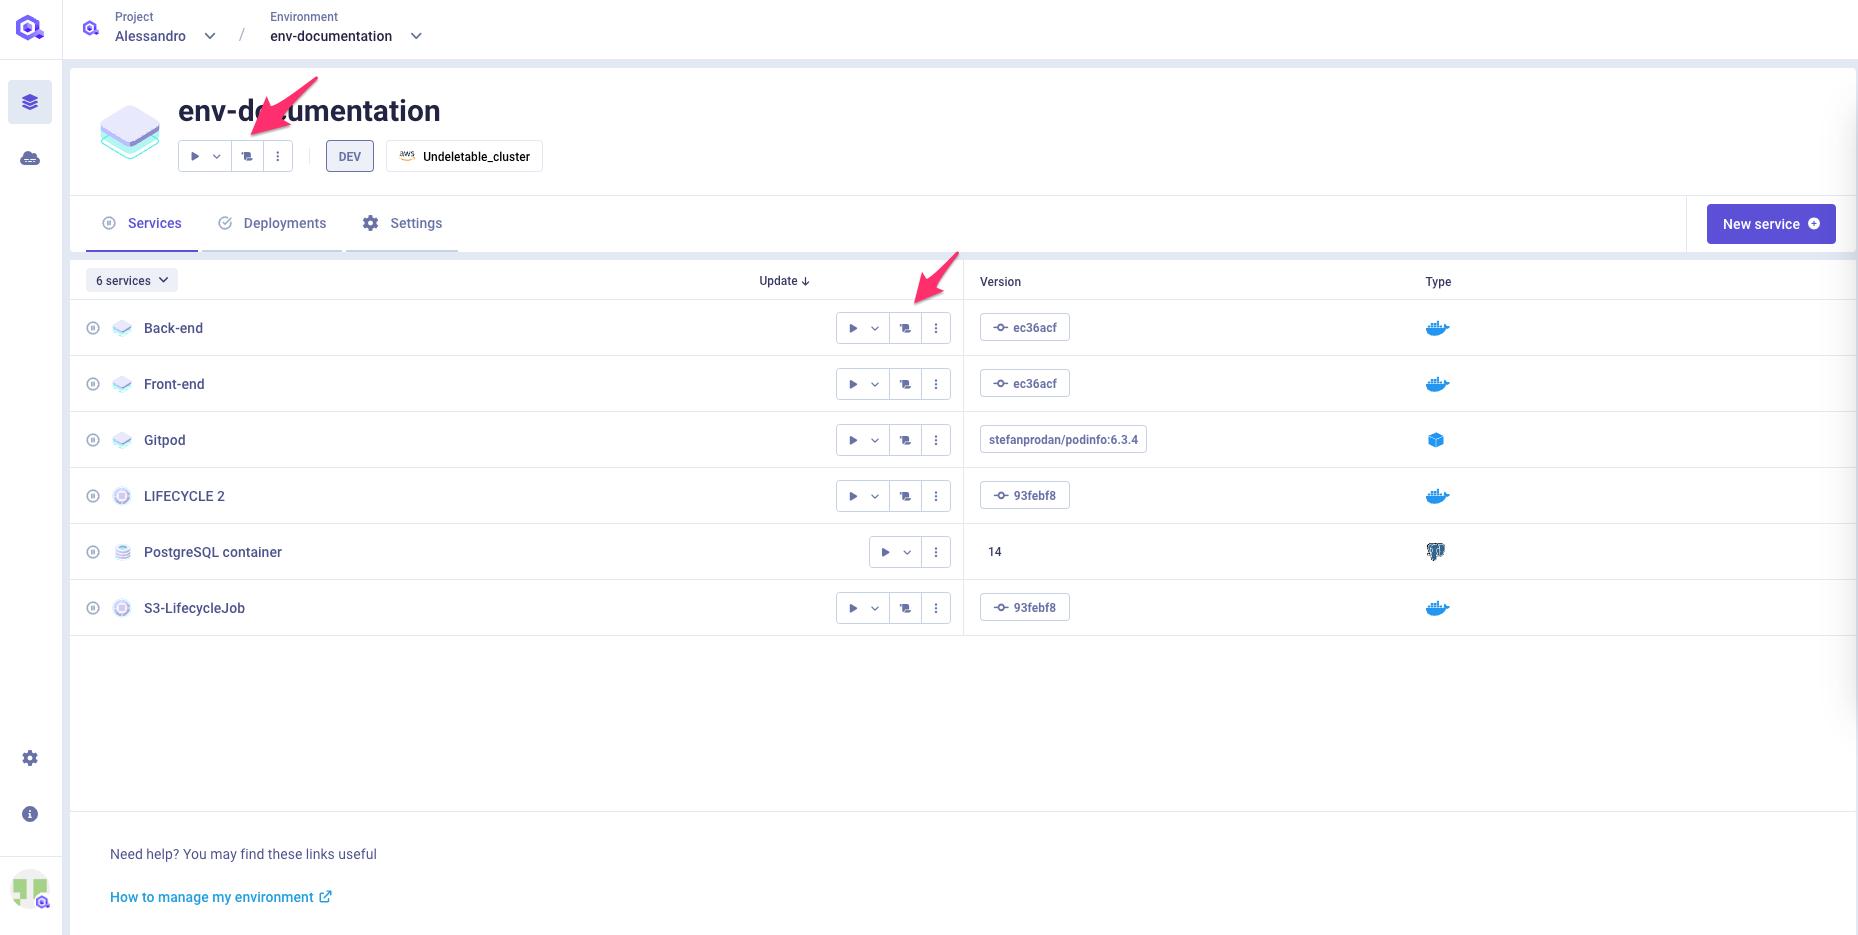
The Logs interface can be accessed from the console by clicking on the parchment icon available in the header or within the table
The interface is composed of two sections:
- A navigation panel (on the left)
- A log section allowing you to switch between the deployment logs and the live logs of a service.
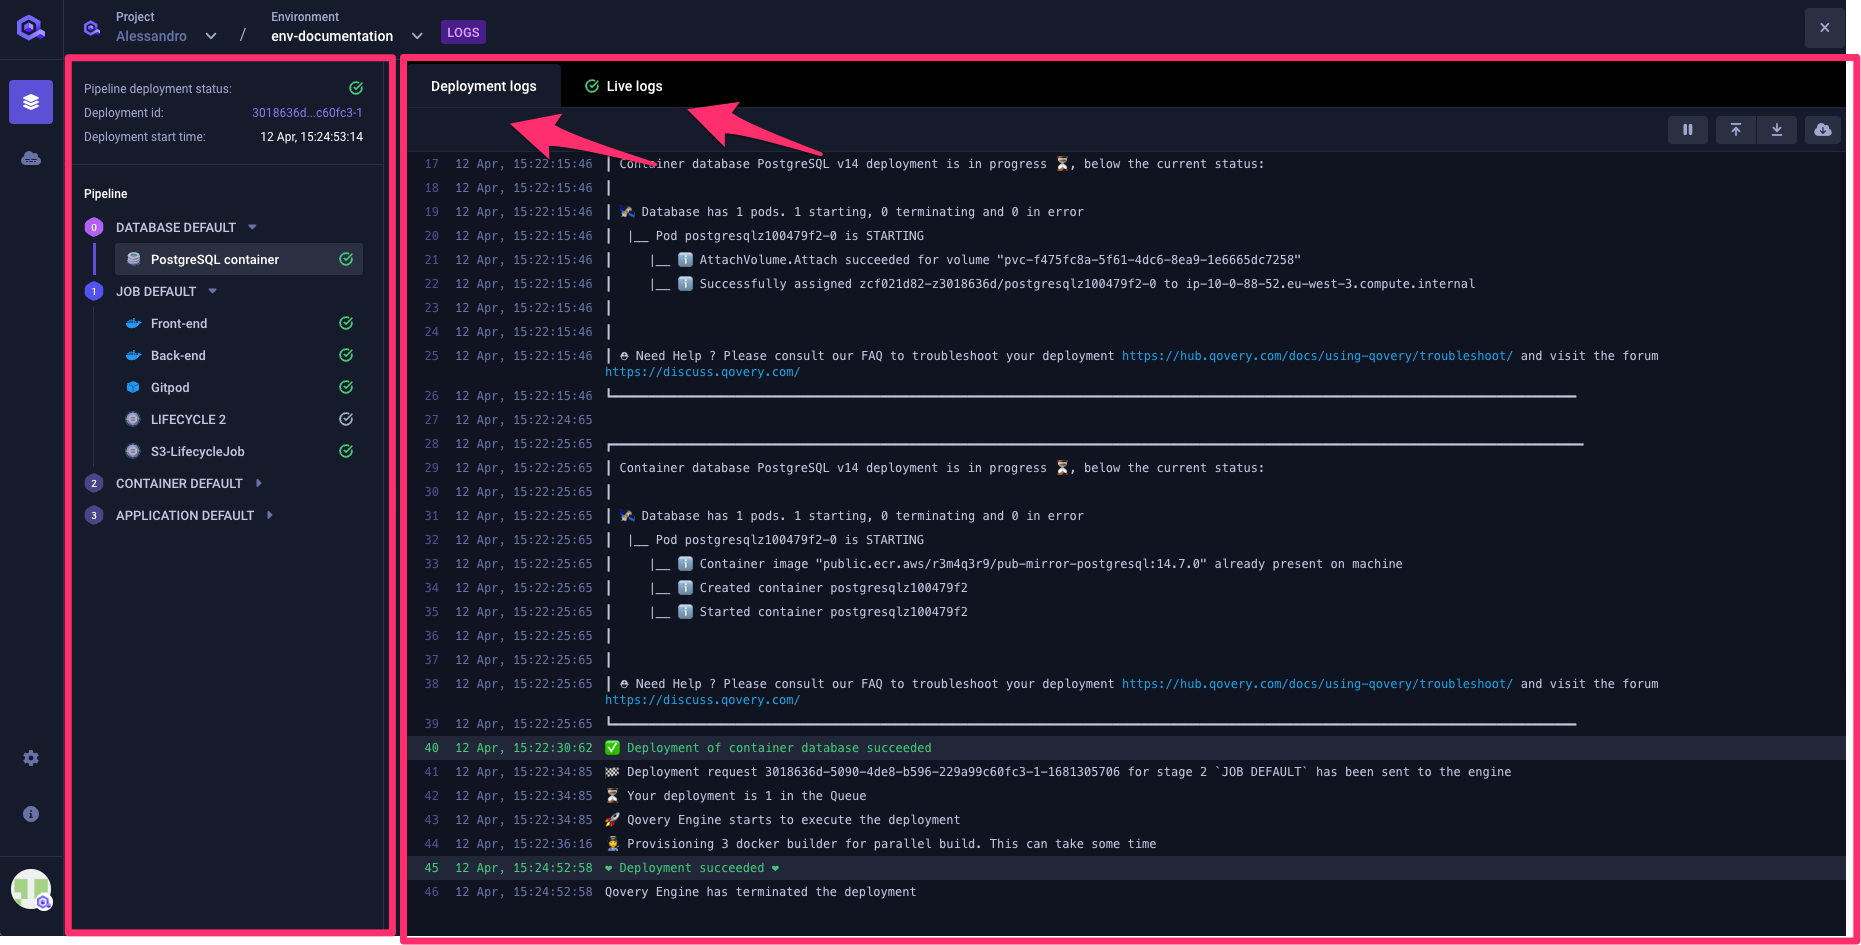
Navigation Panel
This section provides you with some information on the last Deployment that happened on the environment and a navigation system to access the logs of each service of your environment.
More in detail you will find here:
- Deployment information (top section): this section shows you the status of the deployment execution and when it happened. If a deployment is ongoing, its status will be updated accordingly in this section.
- Pipeline view: this section provides an overall view of the current configuration of the Deployment Pipeline and each service present within the environment. By default, only the services that have been deployed within the last deployment execution are displayed but you can still display all of them by un-ticking the option
Last deployed only.
Log section
This section allows you to access the Deployment Logs and the Live logs of each service.
Deployment Logs
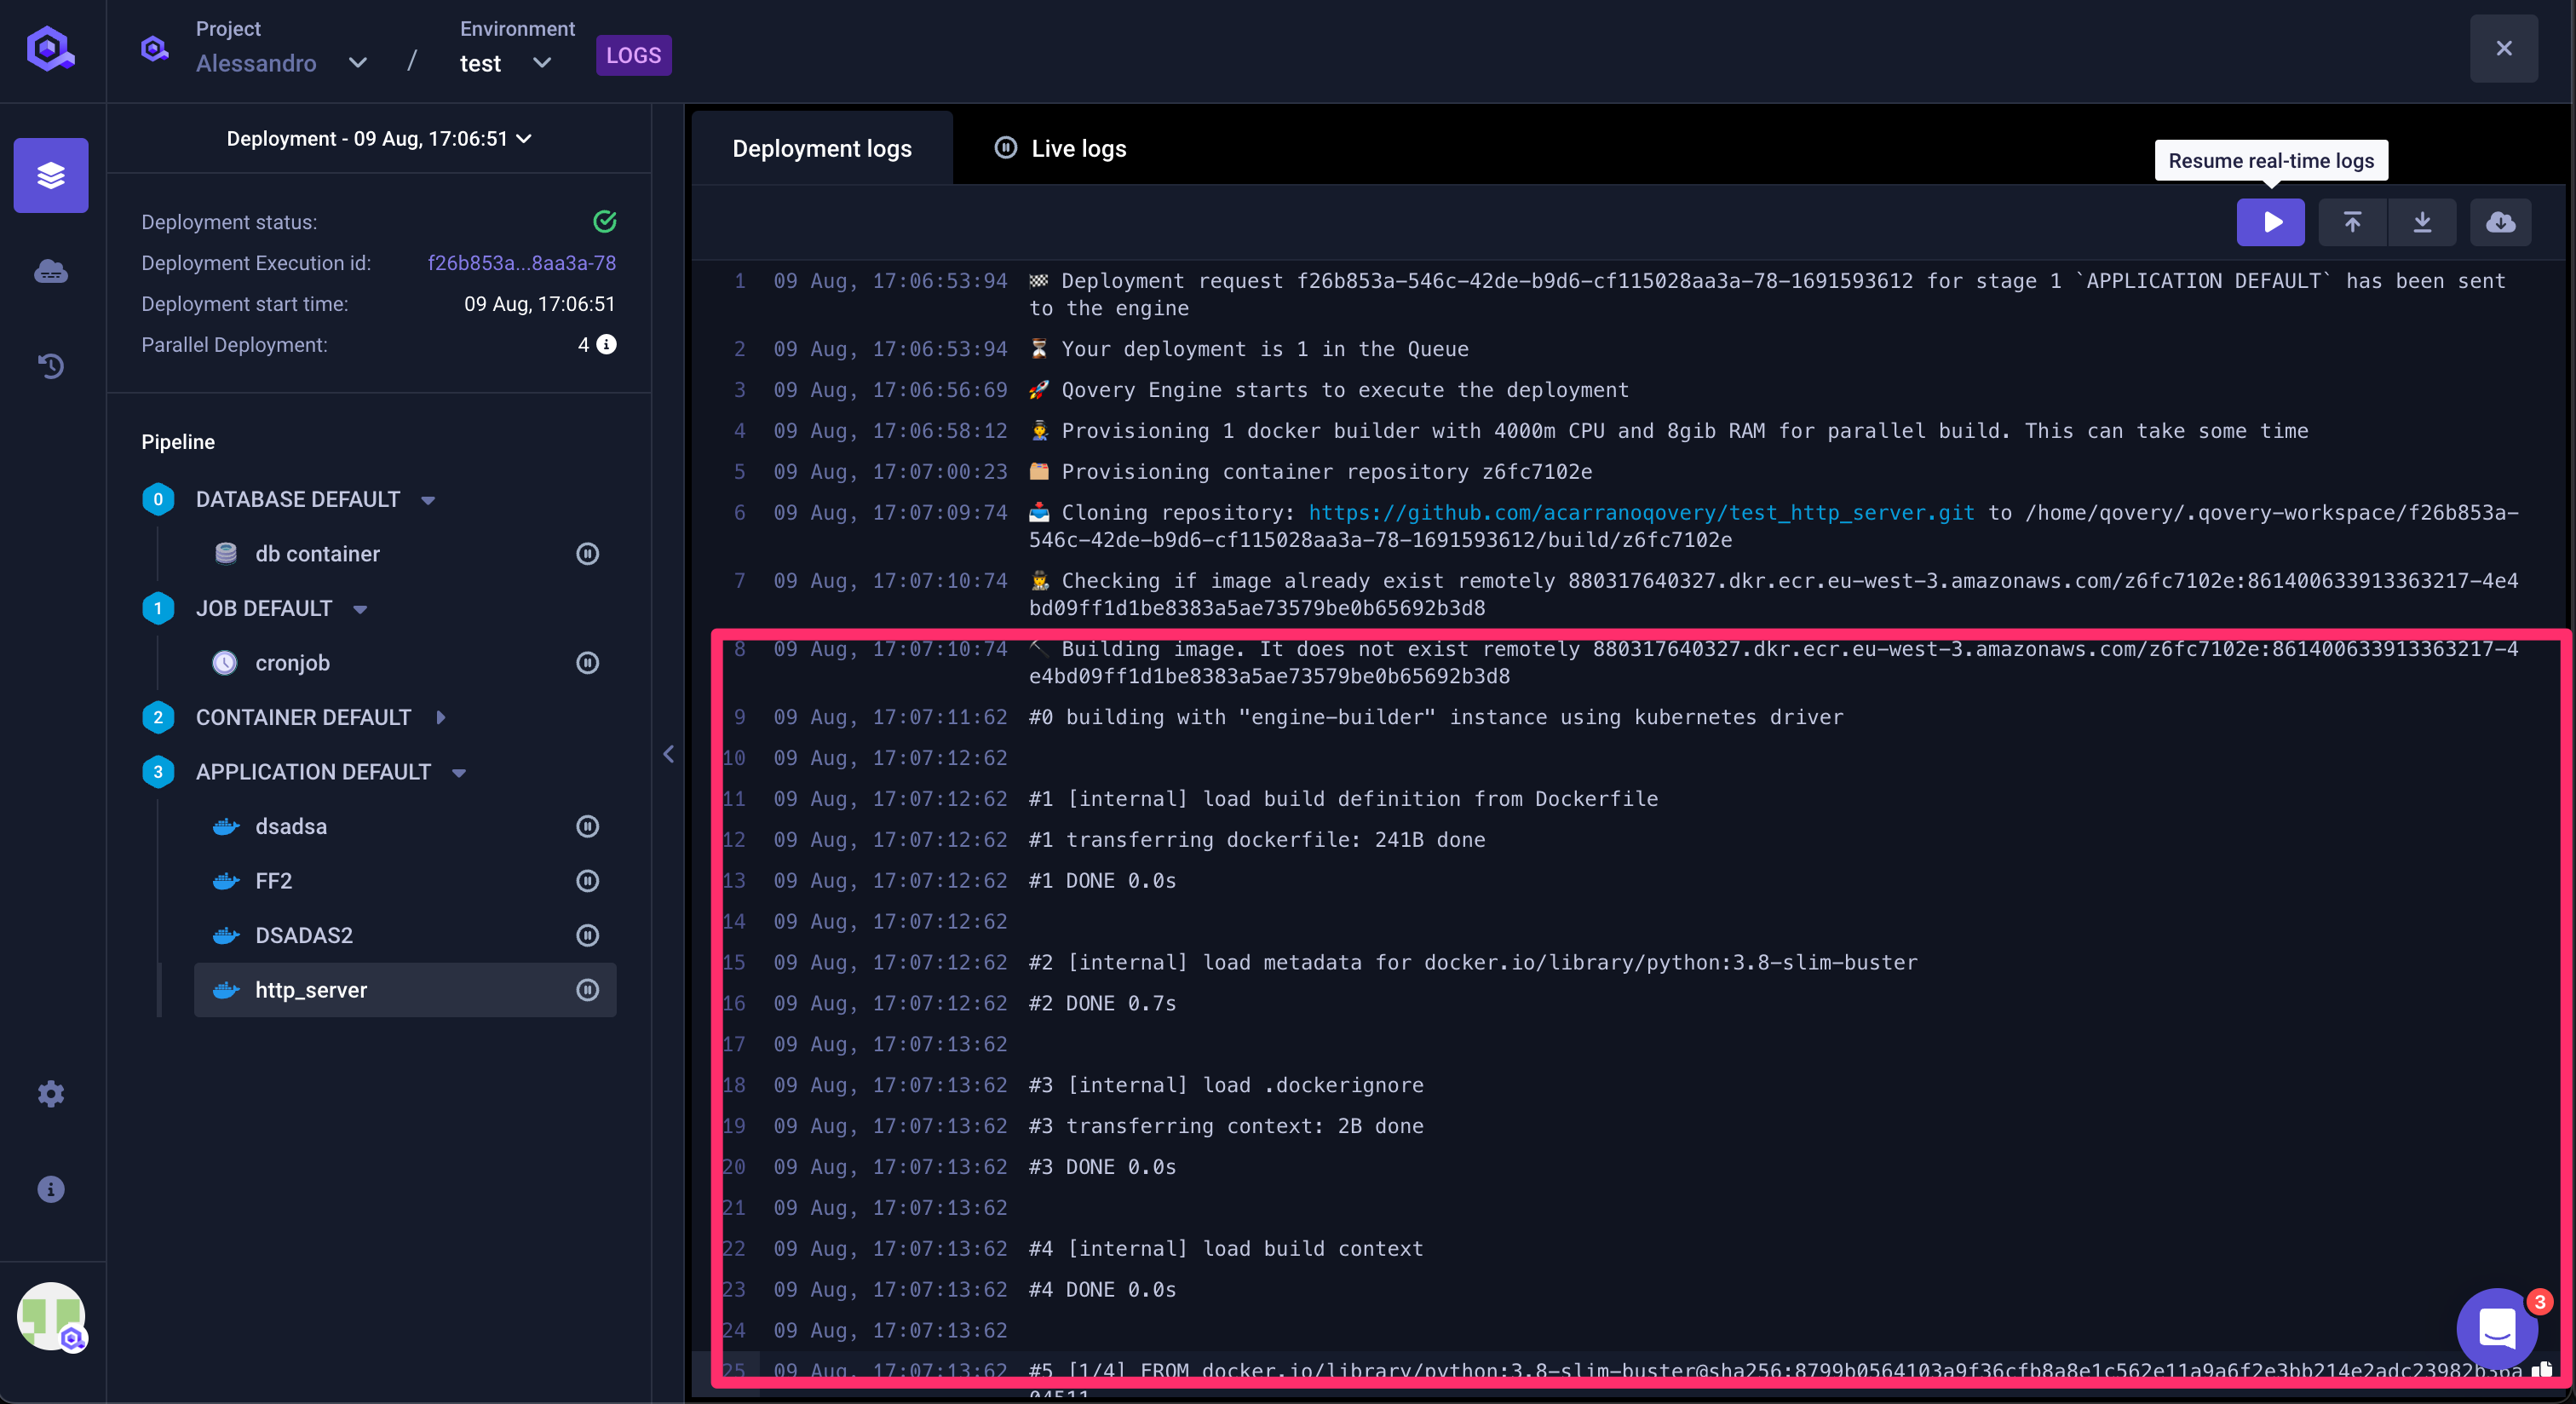
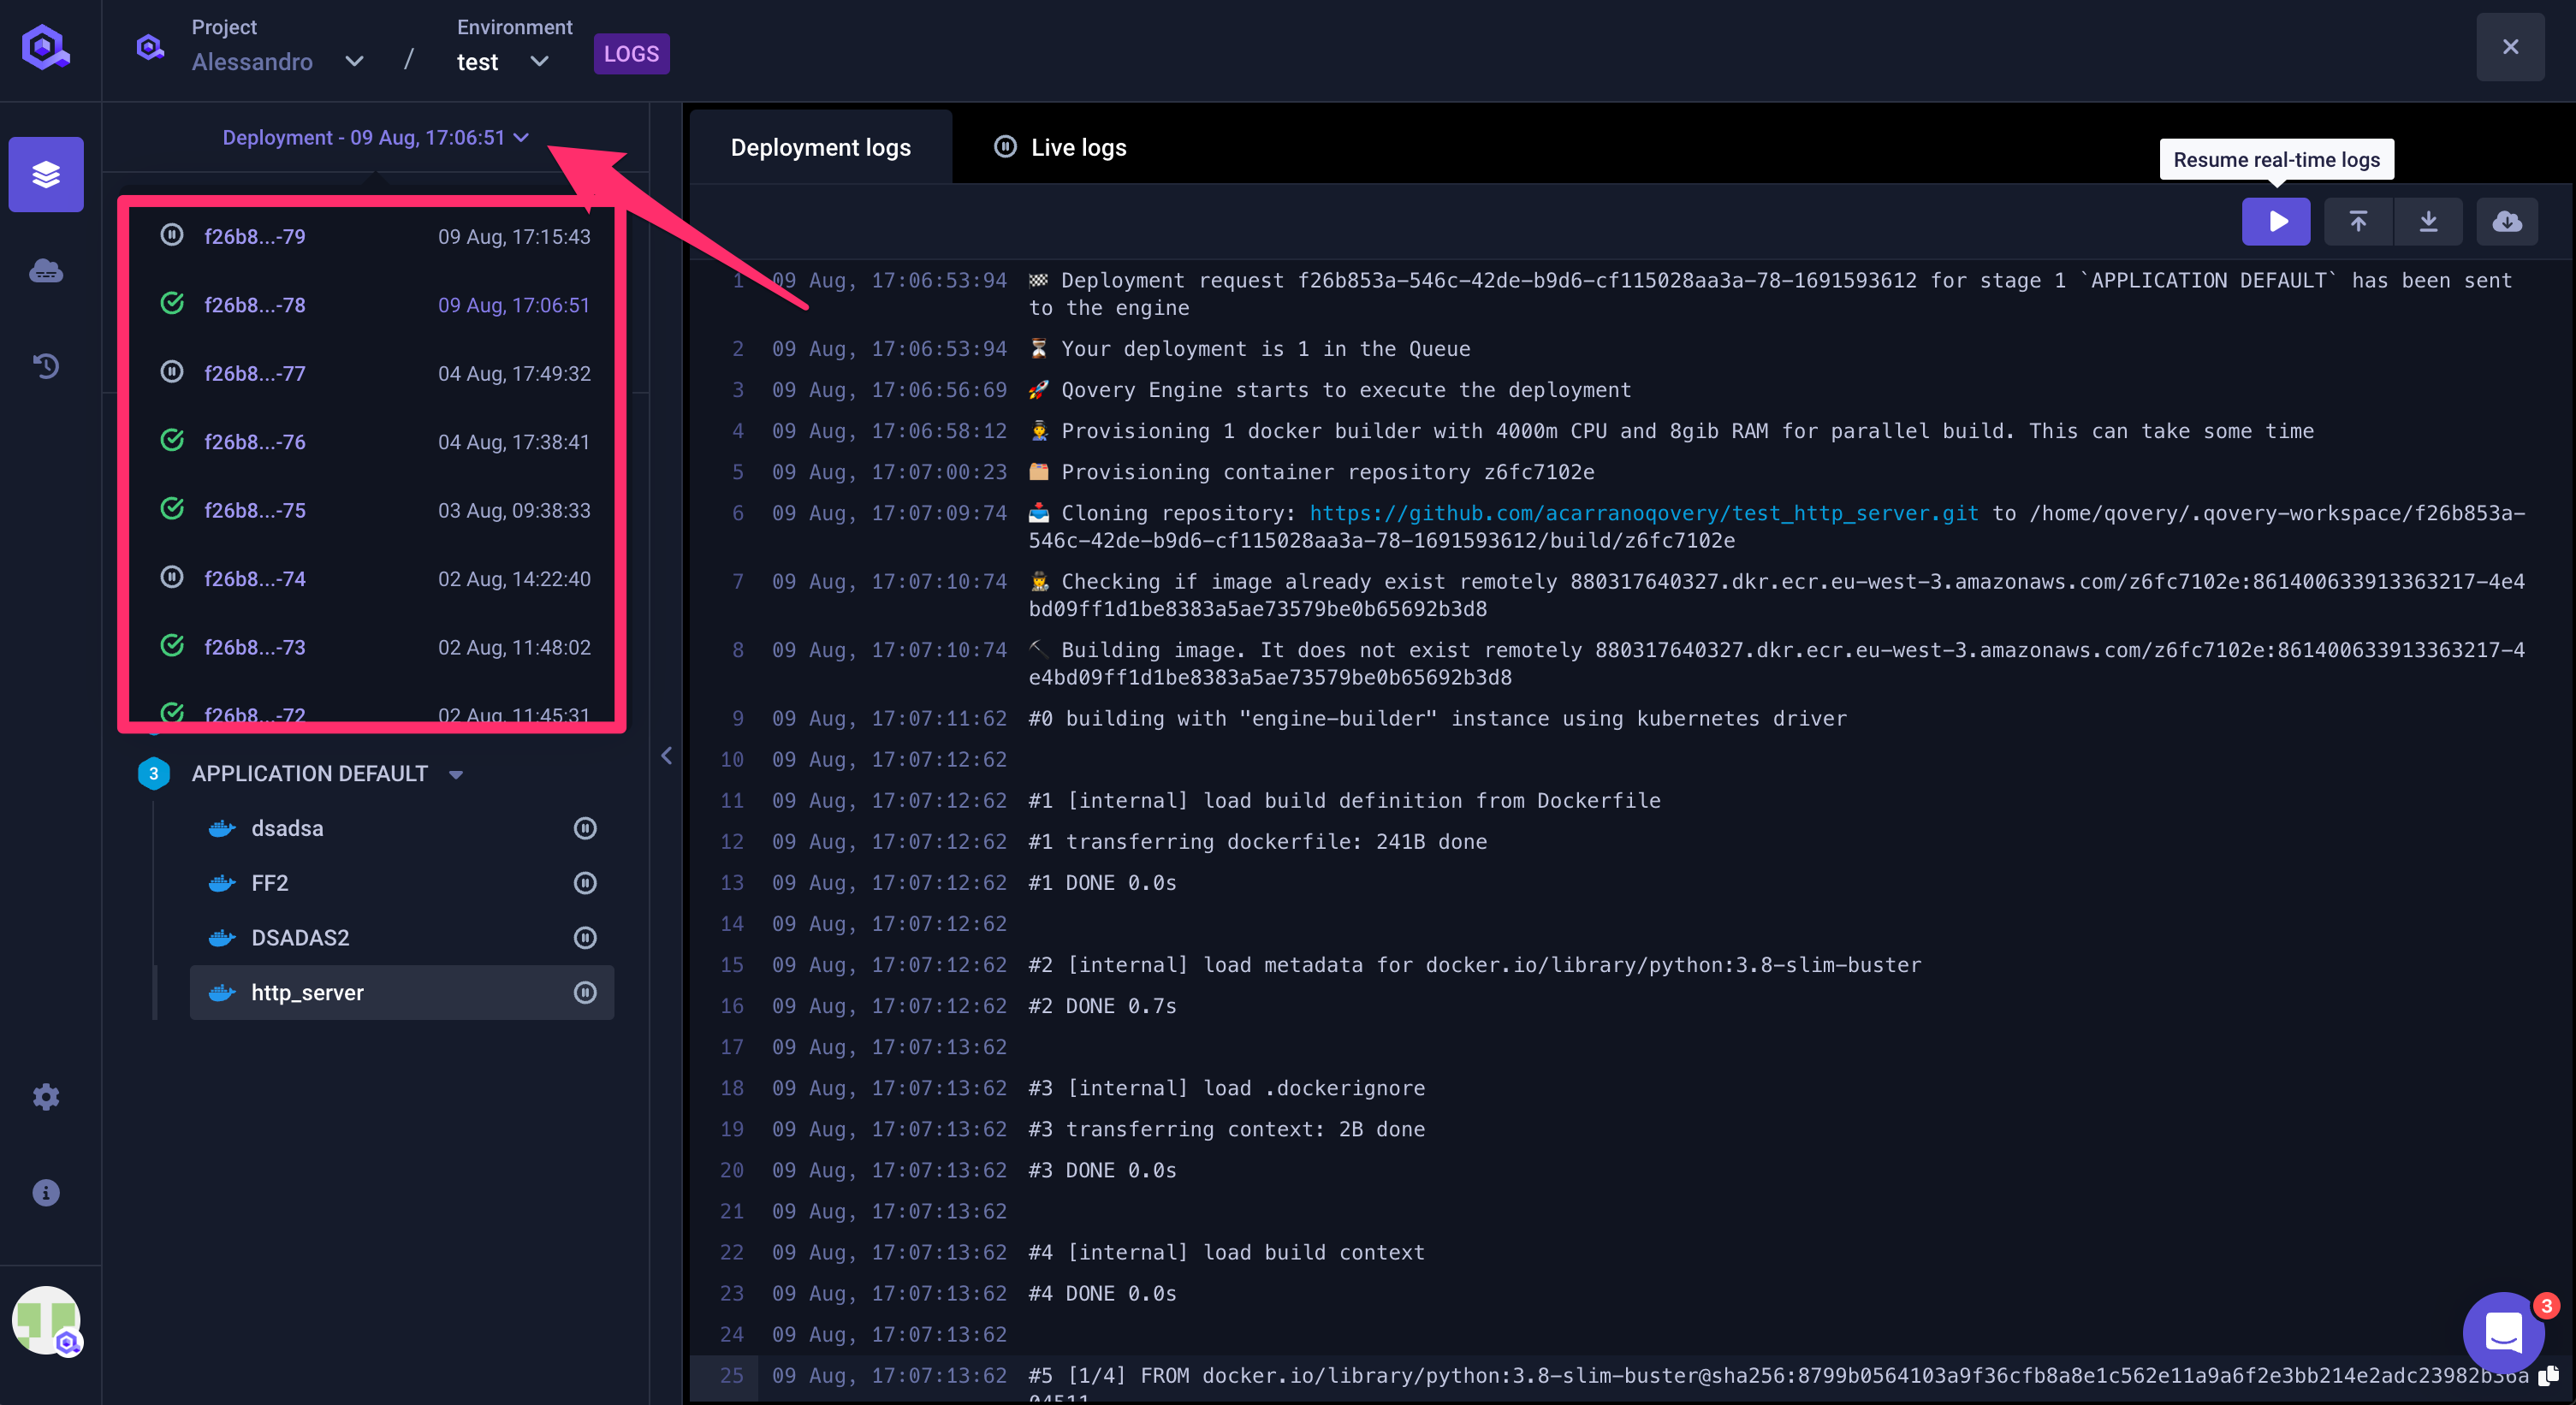
This tab shows you the deployment logs for each service of the environment. By default, you get access to the logs of the last deployment execution but you can switch to the previous execution (See Accessing old deployment logs).
If the service is built via the Qovery CI pipeline, you will get access to the build logs.
When the deployment on Kubernetes is executed, the system will provide you with the deployment status updates. In case of deployment issues, these updates will provide you with some information on the root cause.
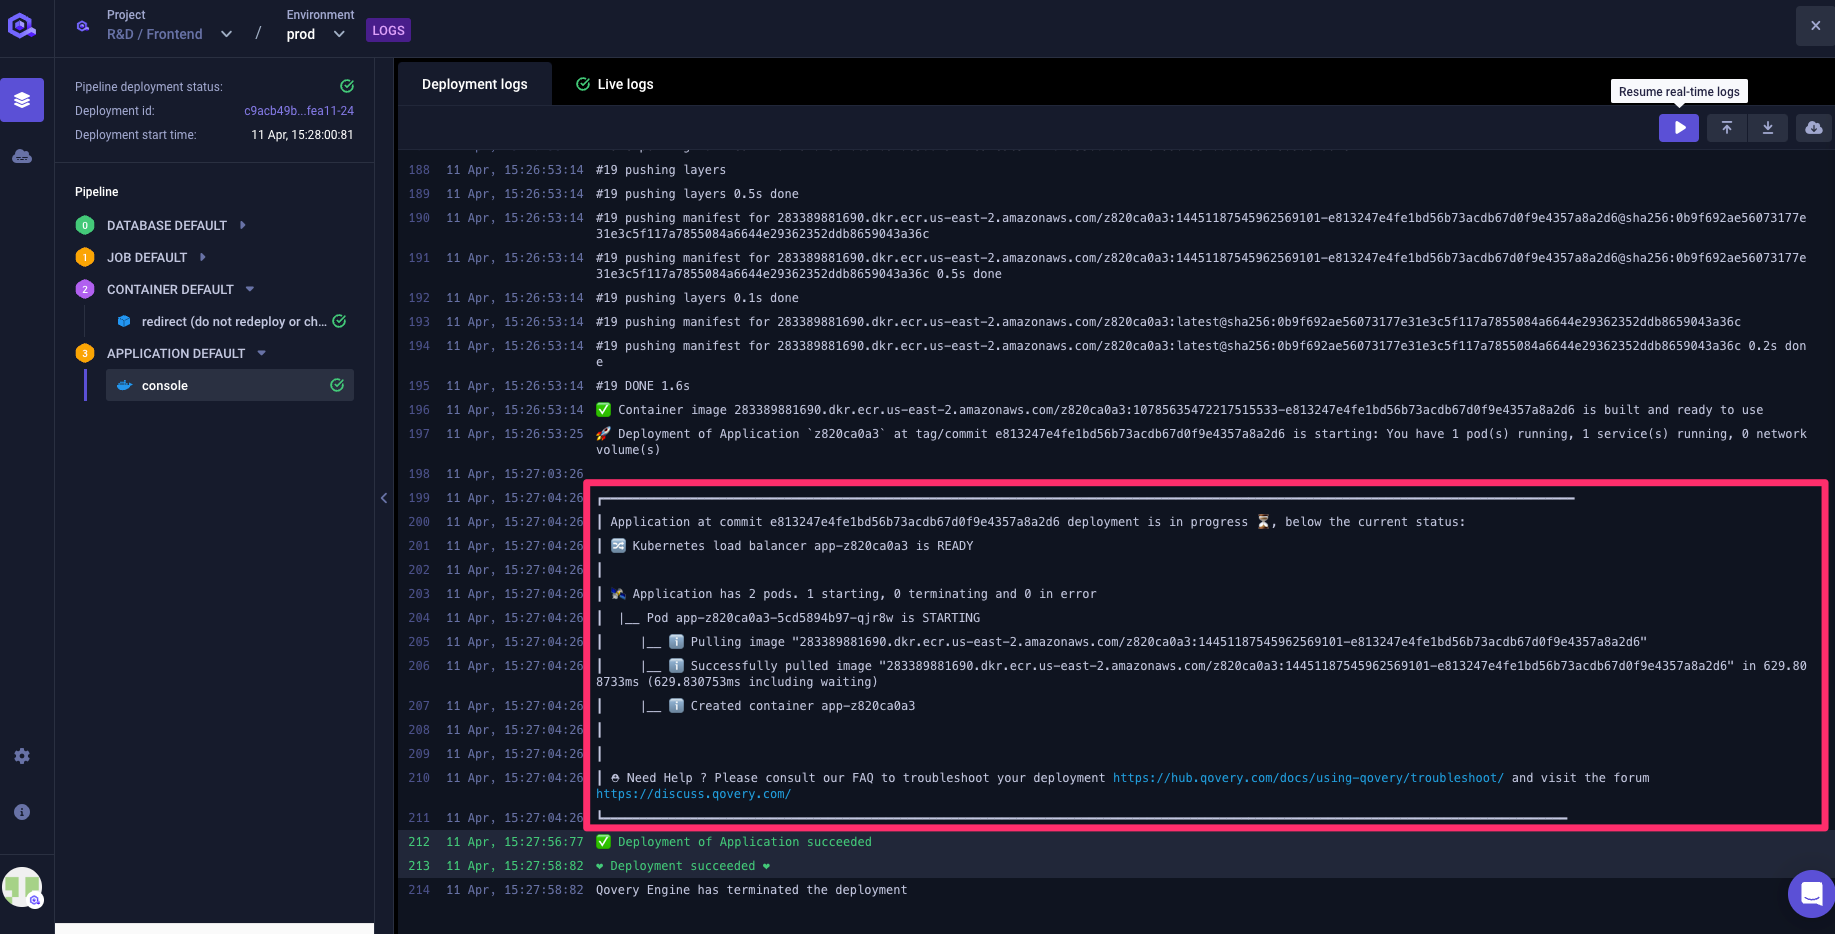
At the end of the deployment, a final message is emitted confirming if the deployment was successful or not and, in case of an issue, it provides you with some information on how to solve the issue.
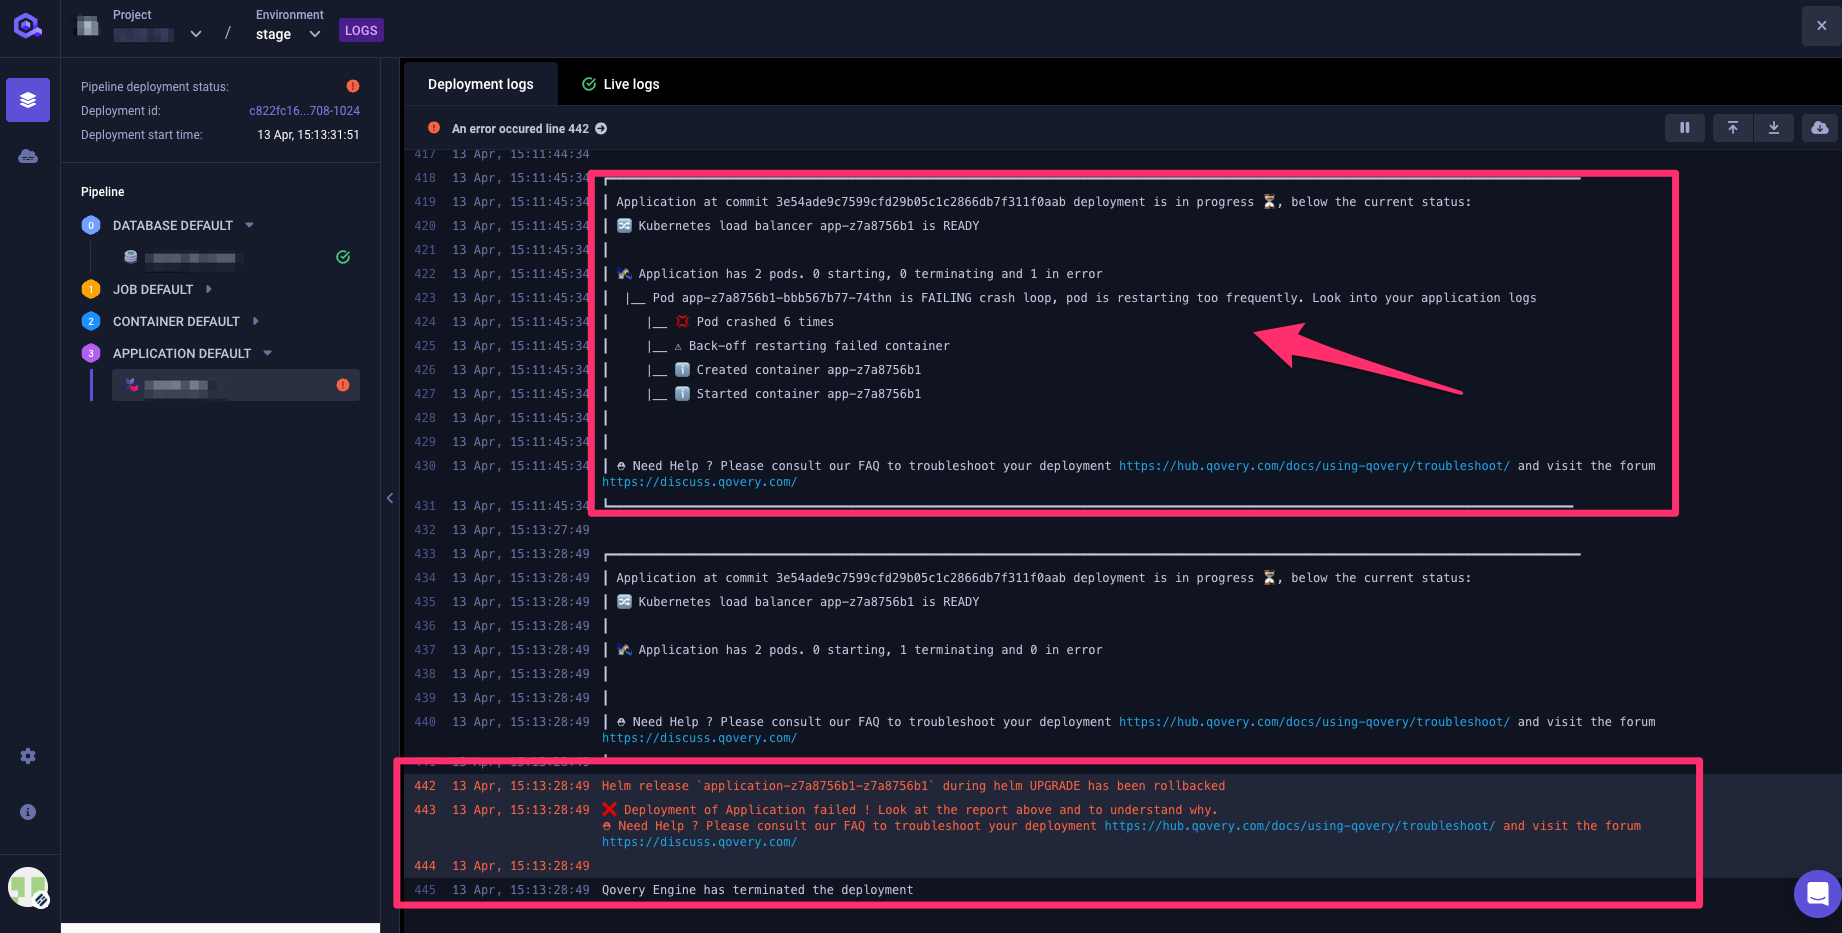
You can use the Troubleshoot section to investigate any issue you might encounter during the deployment of your services.
Accessing old deployment logs
You can access the logs of a past deployment execution in two ways:
- using the
Deployment log switchon the logs view
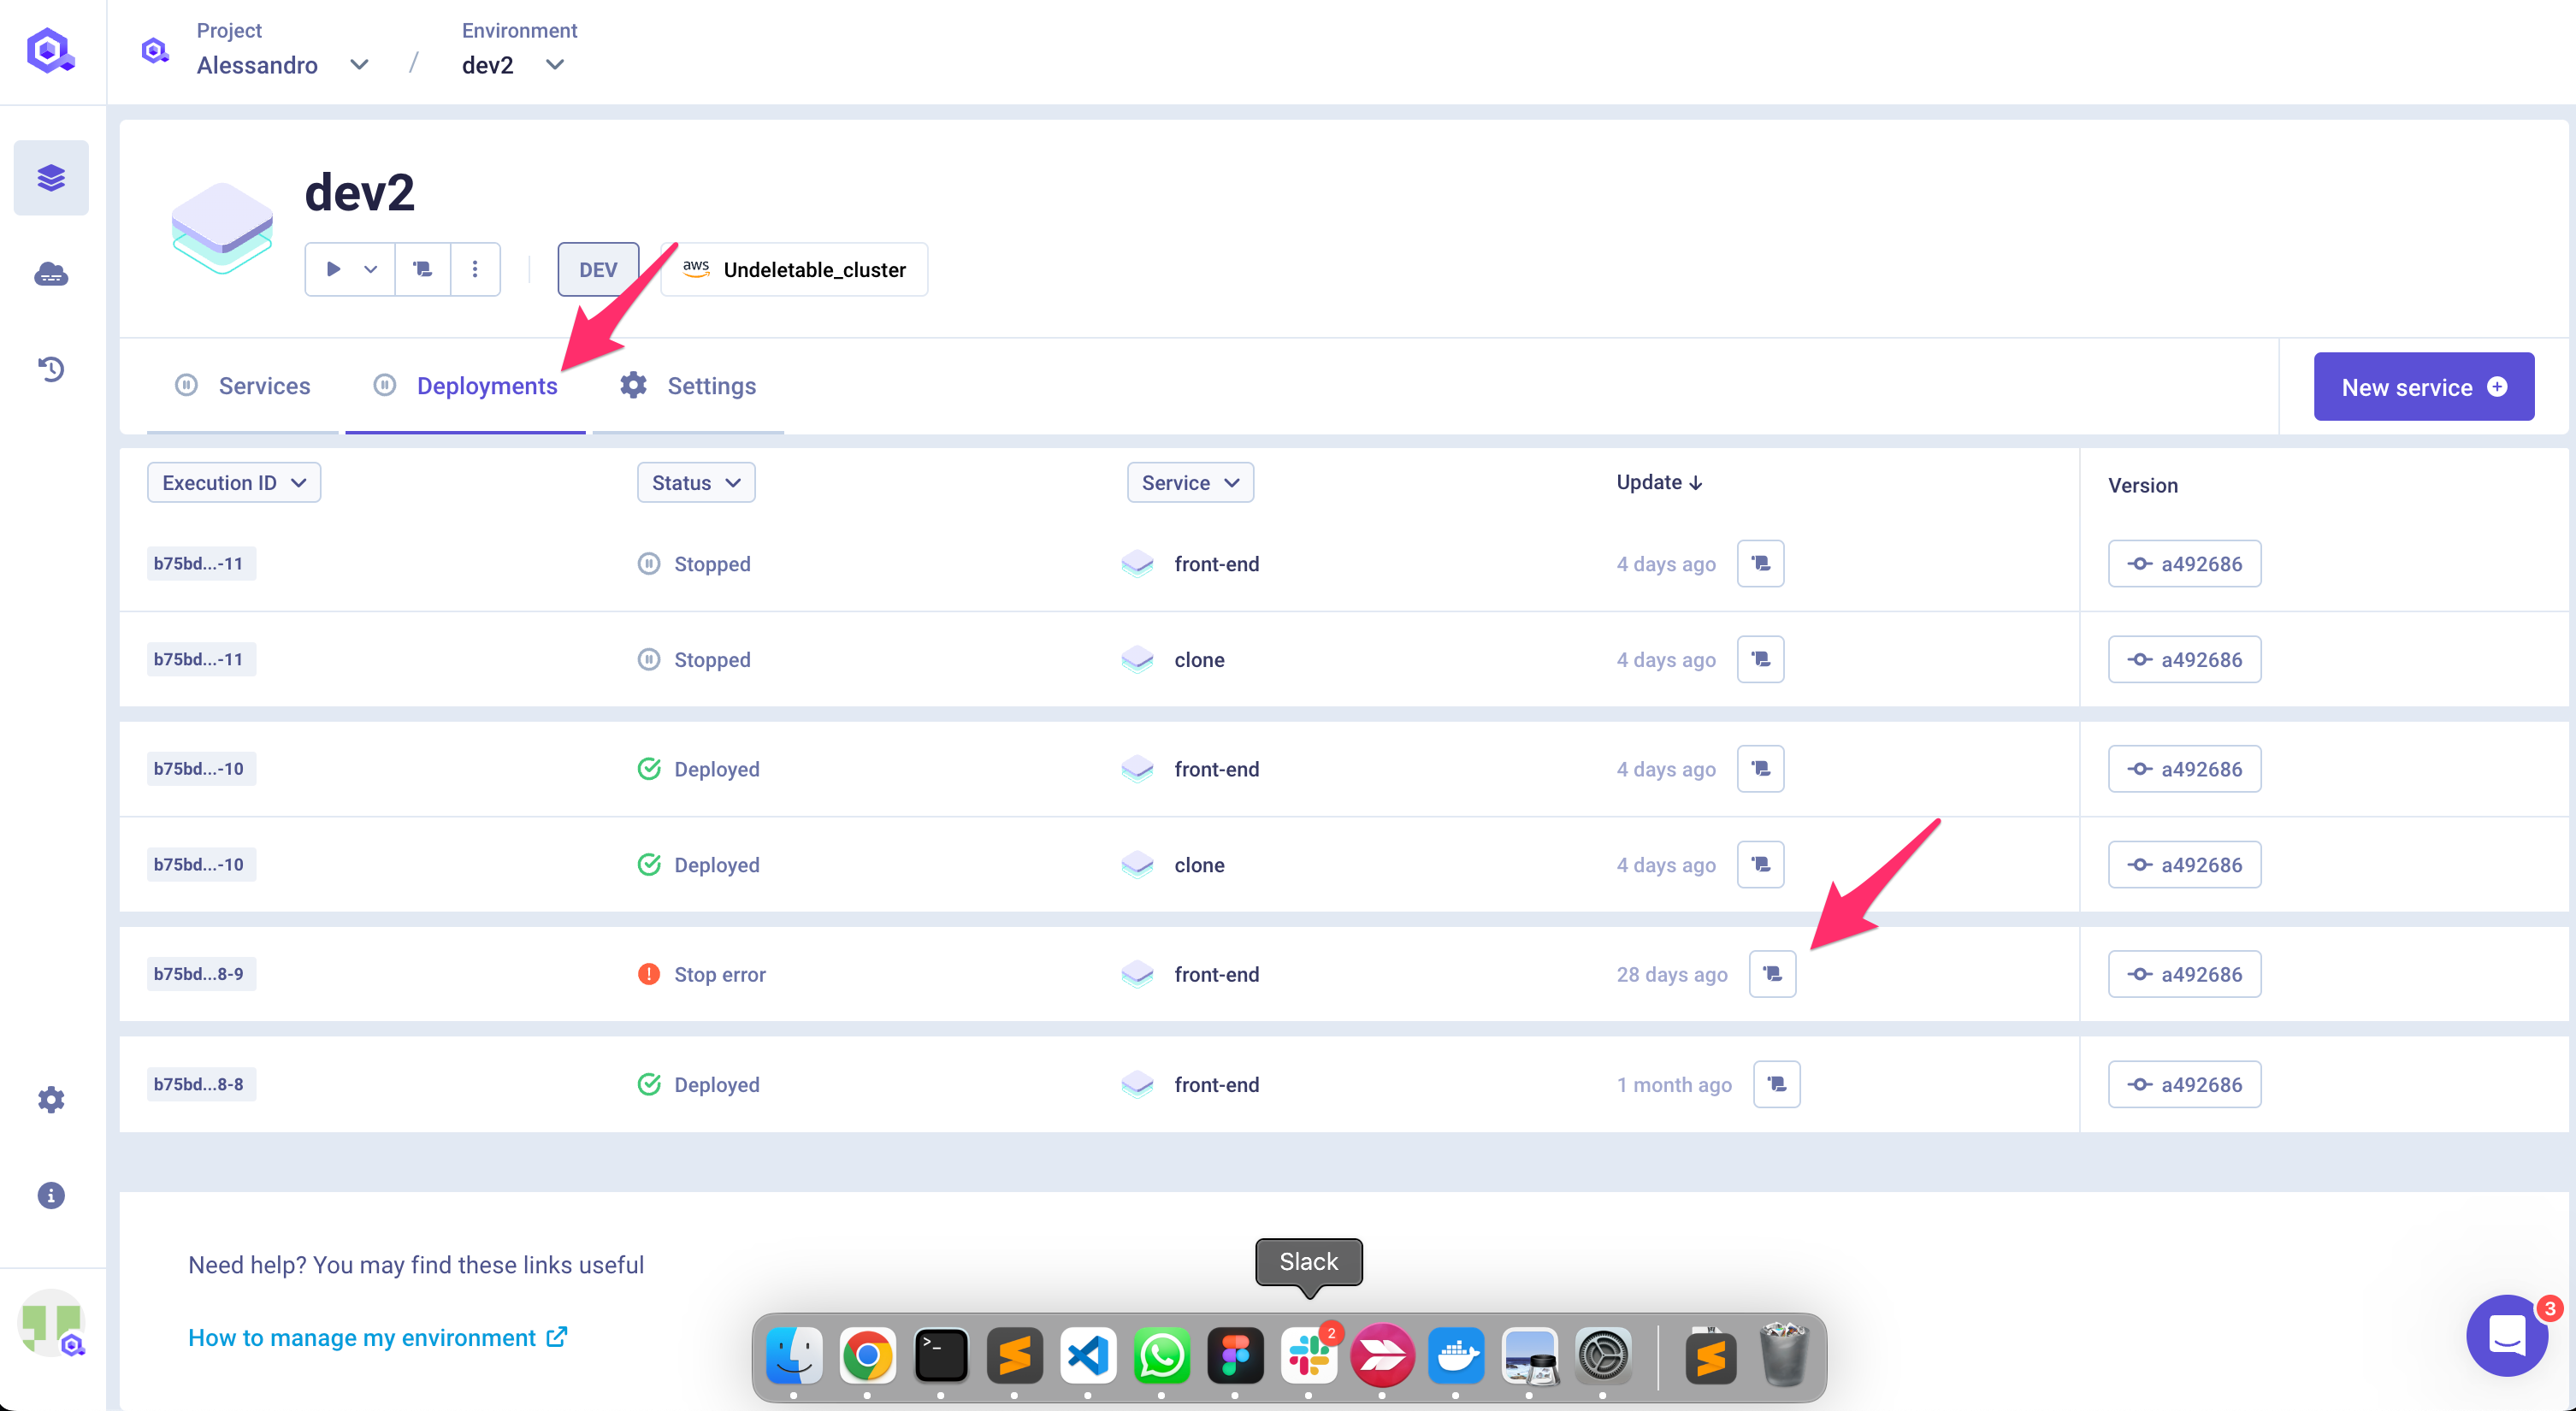
- from the
Deploymenttab from the service or environment page and clicking on theparchmenticon of a previous deployment
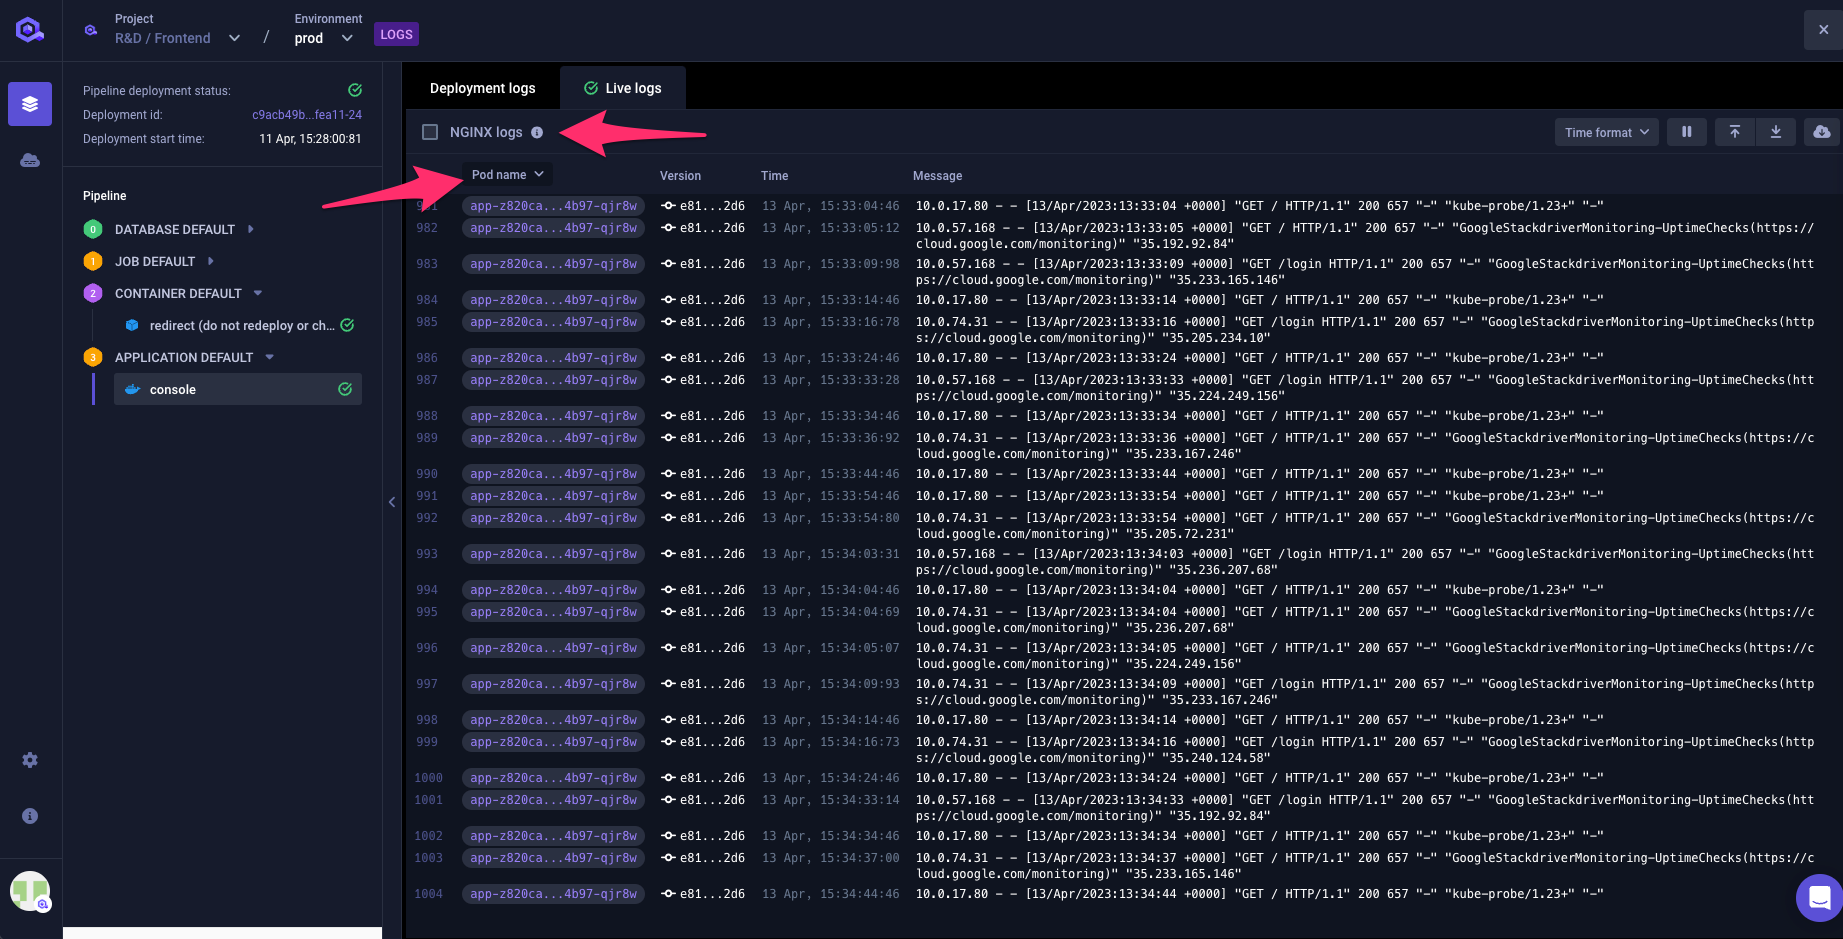
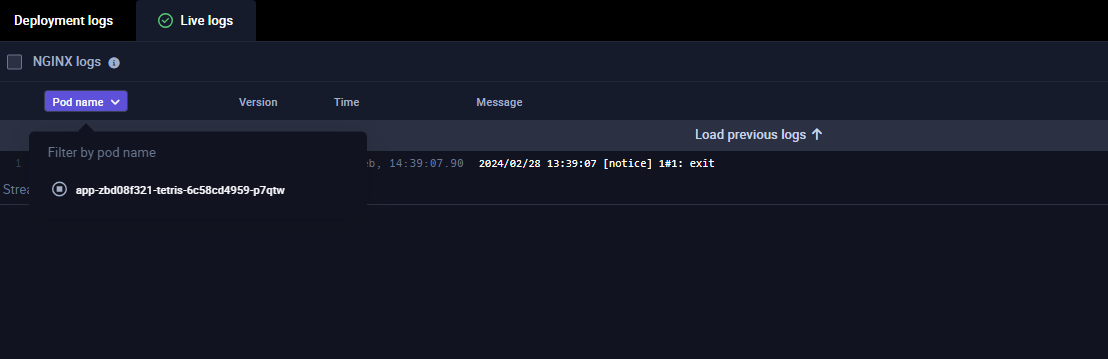
Live Logs
The live logs tab gives you a real-time view on the log generated by your application while running remotely on your cloud provider infrastructure.
Within this section you will find:
- Timestamp: the timestamp of the message
- Pod Name: the name of the kubernetes pod where your application is running (to distinguish the instance in case of the multi-instance app). If you want to follow a specific pod, you can filter the logs by clicking on the pod name
- Version: the commit id or the image tag of the application running on this POD
- Message: the log message
If you have several pods within your application, you have the possiblity to filter the logs by pod.
Past application logs are also preserved on your cluster via Loki and can be accessed from the same log view within the qovery console. Please keep in mind that:
- Loki is configured to preserve only the latest 1000 lines of log for each application and retain them for 12 weeks (configurable via the cluster advanced settings)
- This feature is not available on EC2 Clusters since we don't install Loki.
If you need to troubleshoot issues on the requests managed by your application, you can also access the Nginx logs in the same view (logs format is available in the helper). Note that this option is available only if the application is exposed publicly (See the Port Section)