Audit Logs
Qovery allows you to monitor any action happened within your organization thanks to the audit logs section. This section provides you with a complete view on any change happened within your organization configuration, providing you the answer to "who did what, where, and when?".
This is extremely useful when debugging complex issues and trying to understand what happened in a specific timeframe or monitor the actions done by your users within your organization.
You can access this section by opening the Audit logs section from the nav bar on the left
Once entered this section, you will find here the list of events happened within your organization over the past 30 days (this is the maximum retention time).
Event information
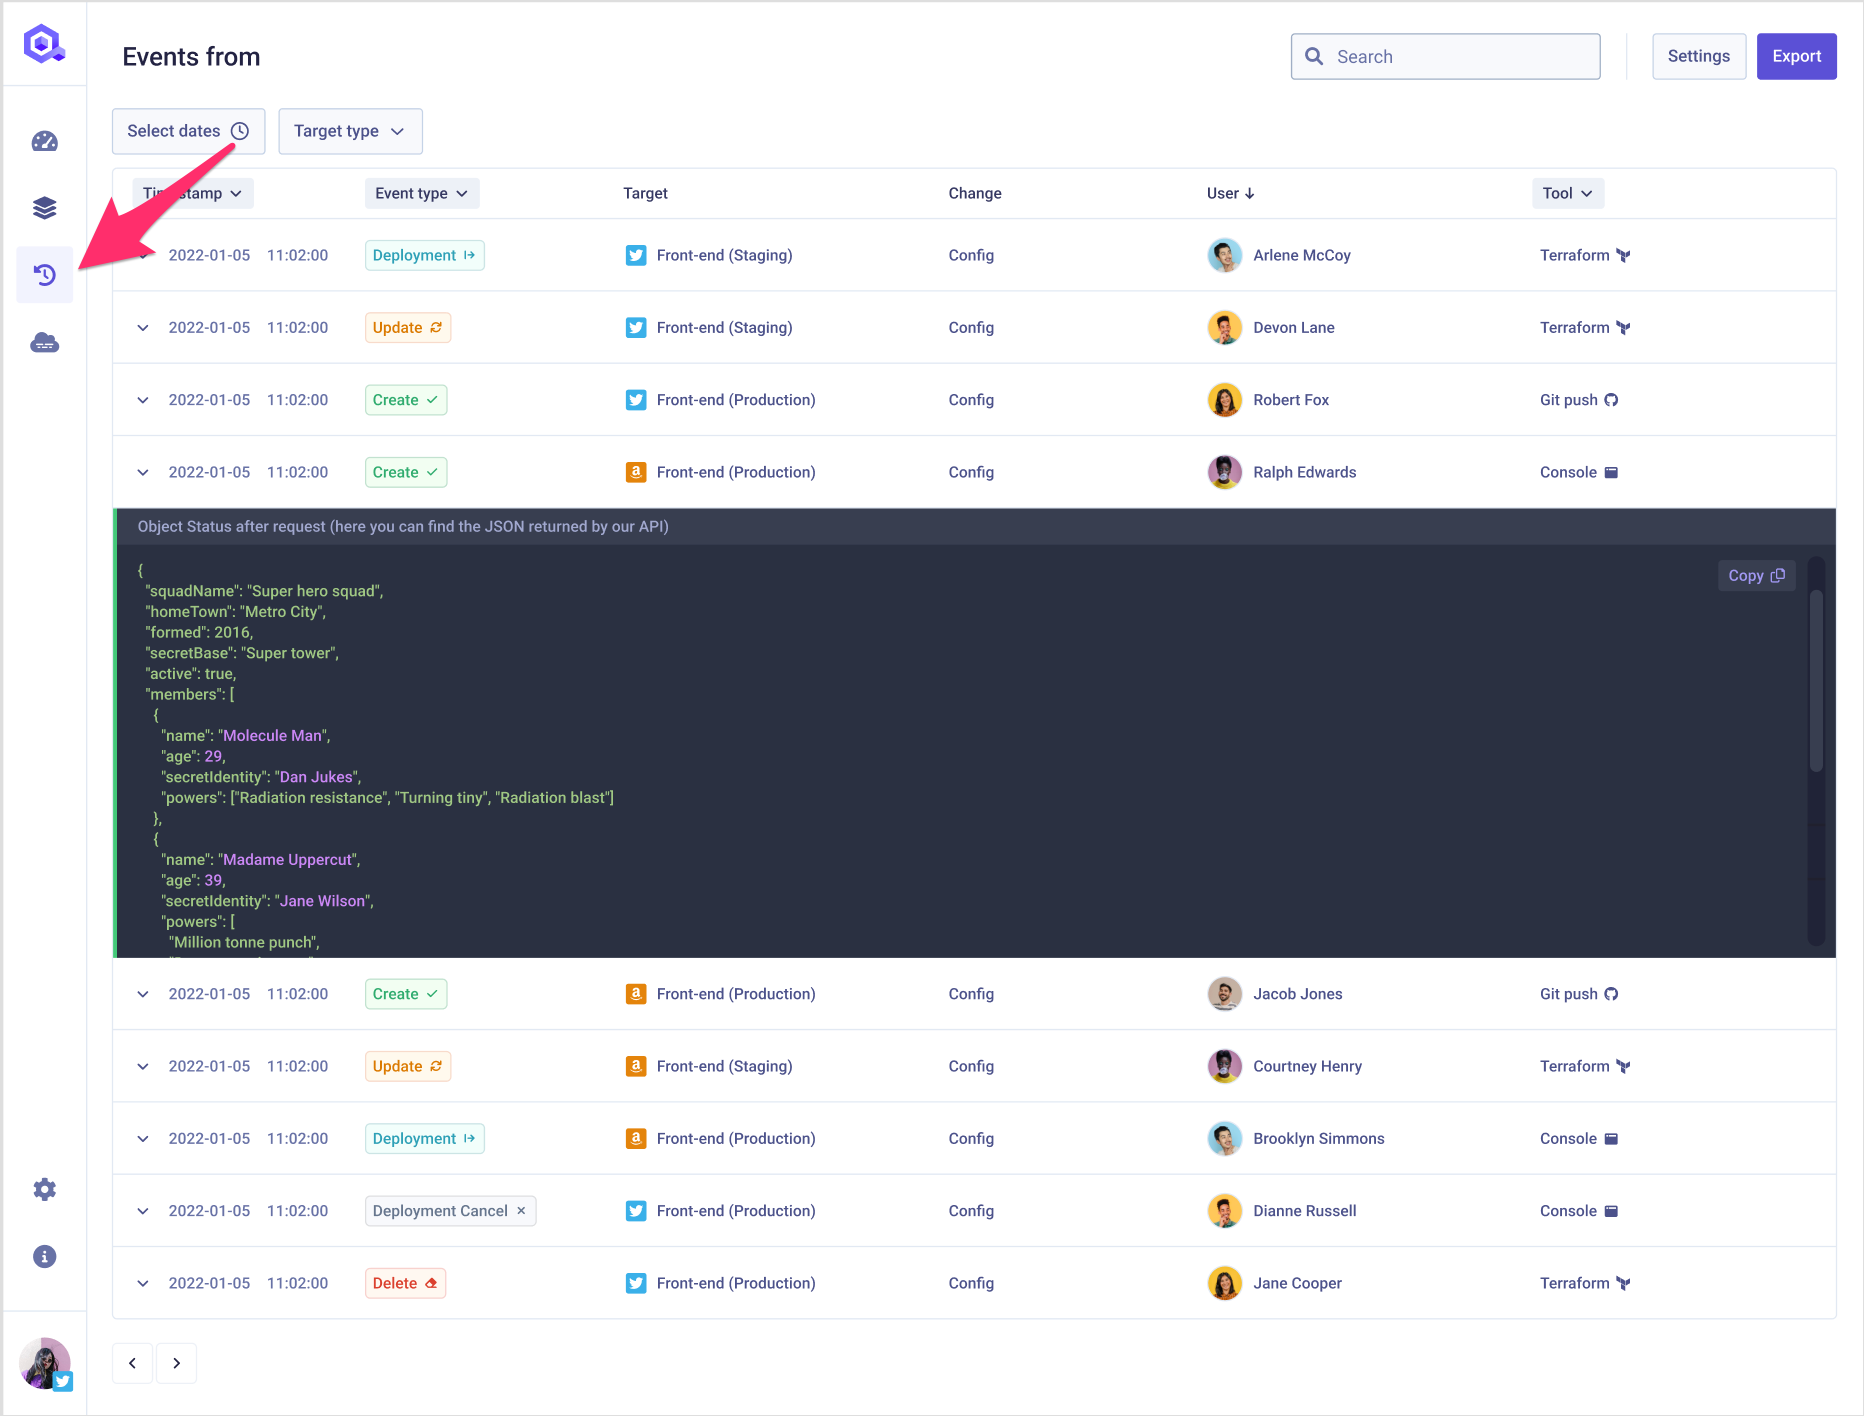
Each event in the list is composed by the following information:
Timestamp: it tells youwhenthe event happenedEvent Type: it describe the type of event (Create, Update, Delete, Trigger Deployment etc..)Target Type: it defines the type of object that has been modified (Environment, Cluster, Role, Image registry etc..)Target: it defines the object that has been modified. You can get additional information on the target by hovering on it.Change: it describeswhathas been modified (high level information: its config, a deployment rule etc..)User: it describeswhomodified the object. If the change has been done via API, you will find theAPI tokenname that has changed it.Tool: it describeshowthe object has been changed (via the console, the qovery terraform provider, via a git push etc..)
Since the audit logs are based on the calls done on our API, Qovery provides you with the JSON sent in the API response for each API call (and thus, for each event). This JSON represents the status of the target object after the event has happened. You can access the JSON by clicking on the event and might be useful to get a more granular information of what has changed between two events of the same type by comparing their JSON.
Example: if an update happened on the configuration of an application , the stored UPDATE event will provide you access to the JSON returned by the API when the /application endpoint was called. This JSON will thus contain the configuration of the application after the update.
Filters
To simplify the research within the audit logs, you can filter the events by:
- Time range
- Target: you will have to specify a target type (cluster, environment, service etc..) and then specify the name of the target. For example, if you want to look for the changes happened on the cluster
Production, you will have to selectClusteras Target type and then you will have to selectProductionfrom within the cluster list.
Quick Filters
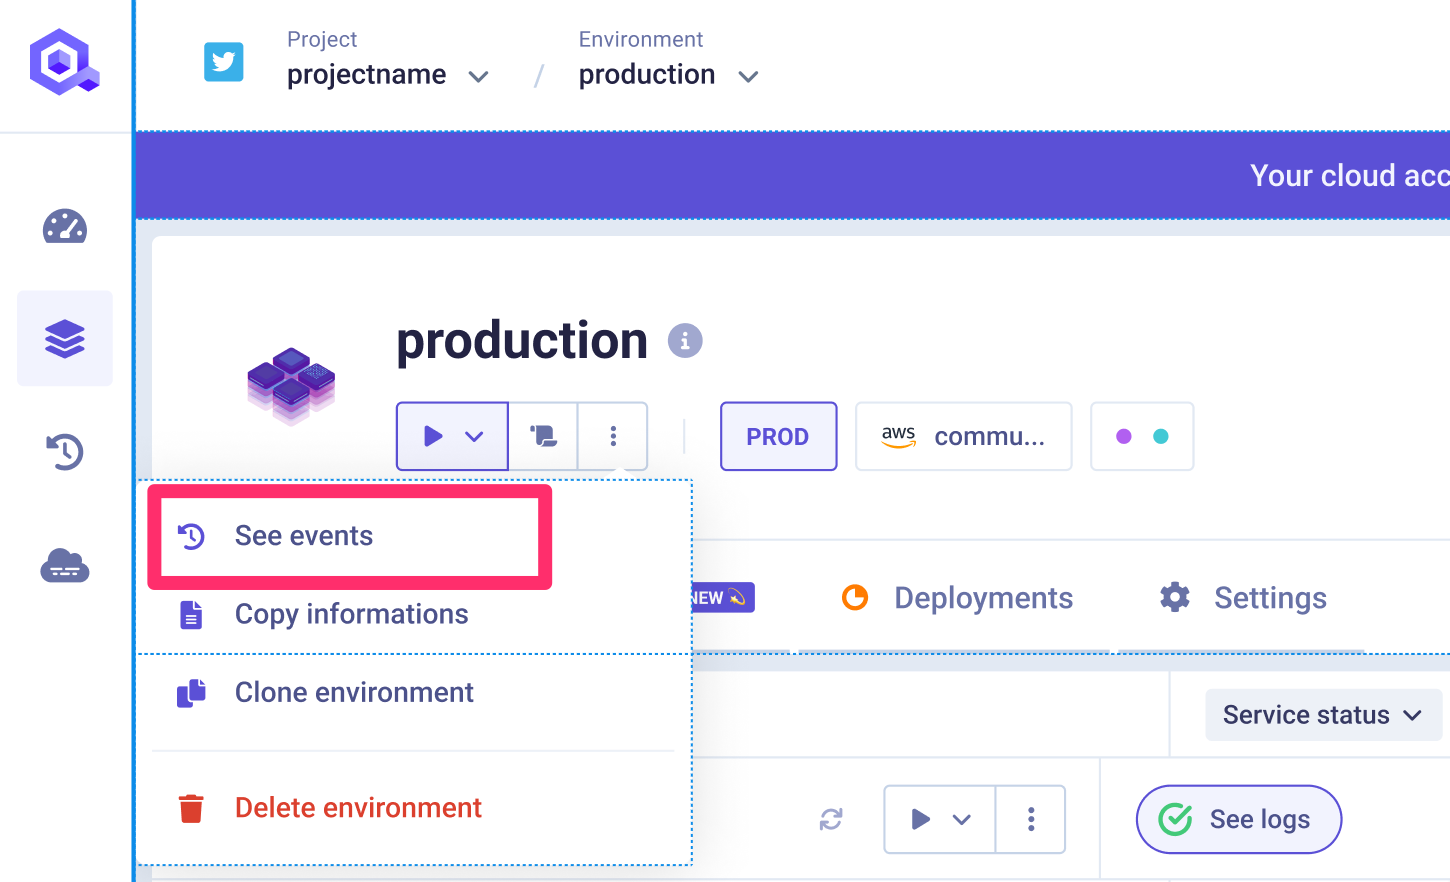
While navigating within the console, a few quick filters allow you to jump on the audit logs and get the events happened on that specific object. For example, you can quickly get the events happened on a specific environment, by clicking on the See Events button available within the 3 dots sub-menu
Export
Not yet available, feature coming soon!