Service Health Checks
Health checks are automatic procedures checking the status of your application, deciding if it is ready to receive traffic or if it needs to be restarted. Since Qovery relies on Kubernetes to deploy and run your application, we use the Kubernetes probes to regularly verify the status of your application during the deployment and/or running phases.
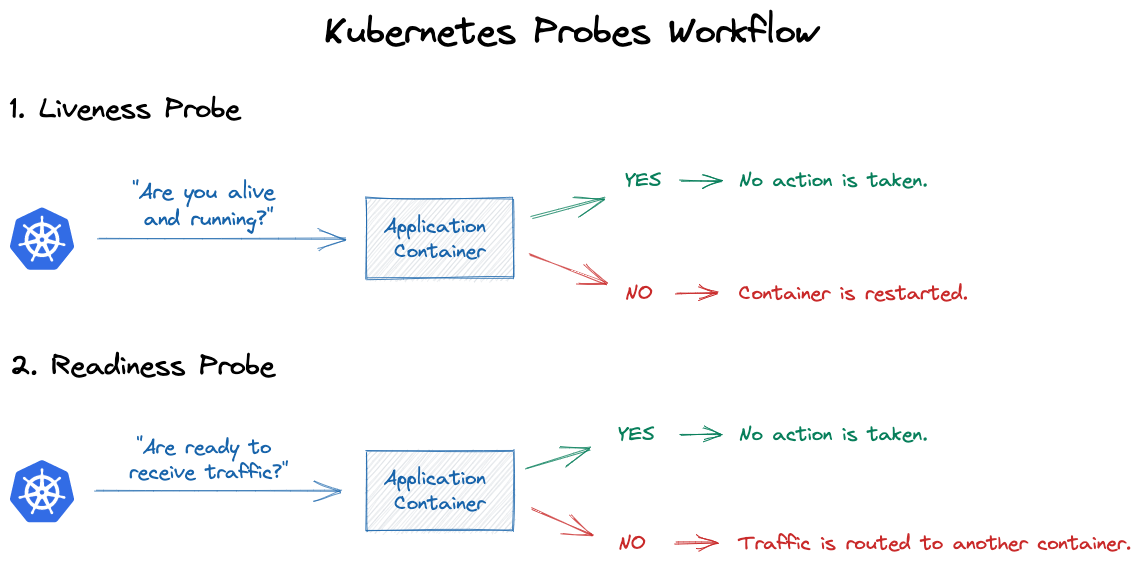
Kubernetes allows you to configure two probes:
- Liveness probe: to check if the application container is alive (passing) or dead (failing). If the check fails, the dead container is restarted to attempt to heal the application. For example, liveness probes could catch a deadlock, where an application is running, but unable to make progress. Restarting a container in such a state can help to make the application more available despite bugs.
- Readiness probe: to check if the application container is ready to receive requests (as even alive containers can enter phases where they cannot handle incoming traffic). Kubernetes only routes traffic to the application if the check succeeds. One use of this signal is to control which Pods are used as backends for Services. When a Pod is not ready, it is removed from Service load balancers.
During the deployment phase, the liveness and readiness probes play an important role on determining if the deployment succeeds or not. If you have both the liveness and readiness probes configured, both of them need to succeed before considering the deployment to be completed successfully.
Example: You have a liveness probe configured on port 80 of your application. If during the deployment of your application the probes can't connect to port 80 and we reach a timeout, the deployment fails.
Qovery allows you to manage these probes directly from within the Qovery console during the setup of your application, letting you decide their activation, configuration and check frequency.
Probes can be configured for:
- Applications
- Cronjobs
- Lifecycle Jobs
Probes Configuration
The following configuration parameters are valid for both the Liveness and the Readiness probes.
Type
Allows you to specify the type of probe you want to run against your application:
- NONE if
NONEis selected, the probe is disabled and thus Kubernetes won't be able to verify the state of your application and take the right corrective actions.
HTTP probes are the most common probe type. You can use them if your application is a HTTP server, or if you create a lightweight HTTP server inside your application specifically to respond to such probes. When using a HTTP probe, you need to configure:
- a port
- a path
Once configured, Kubernetes pings a path (for example:
/healthz) at a given port. If it gets a response in the 200 or 300 range, the check is passed. Otherwise, it is considered as failed and Kubernetes takes the necessary corrective actions.
TCP probes are most often used when HTTP or command probes aren't an option. When using a TCP Liveness probe, Kubernetes tries to establish a connection on the specified port. If the connection is successful, the application is considered healthy. Otherwise, it is considered dead and the container is restarted.
gRPC probes When using a gRCP Liveness probe, Kubernetes tries to establish a connection on the specified port and service. If the connection is successful, the application is considered healthy. Otherwise, it is considered dead and the container is restarted.
EXEC probes Exec probes allow to define a command to be executed within your container. If the command execution fails, the probe is considered as failed.
Initial Delay (in seconds)
Allows you to specify an interval, in seconds, between the application container start and the first liveness check.
Allowing additional time for the application to start can be useful when boot time usually takes too long (due to long boot operations), or when the application opens the port before being ready to receive traffic on it (due to a still ongoing boot operation).
Period (in seconds)
Allows you to specify an interval, in seconds, between each probe.
Timeout (in seconds)
Allows you to specify the interval, in seconds, after which the probe times out.
Success Threshold
Allows you to specify how many consecutive successes are needed, as a minimum, for the probe to be considered successful after having failed previously.
Failure Threshold
Allows you to specify how many consecutive failures are needed, as a minimum, for the probe to be considered failed after having succeeded previously.
Configuiration for Long-starting application
If your application has a long boot operation to run, your deployment might be marked as failed since the probe can't verify the state of your application within the specified time frame. In this case, you will find in your deployment logs a warning message Liveness probe failed: dial tcp xx.xx.xx.xx:xx: connect: connection refused , telling you that the probe is failing.
If your application needs more time to boot, increase the Initial Delay in seconds of the probes to match the application boot time.