Running and Deployment Statuses
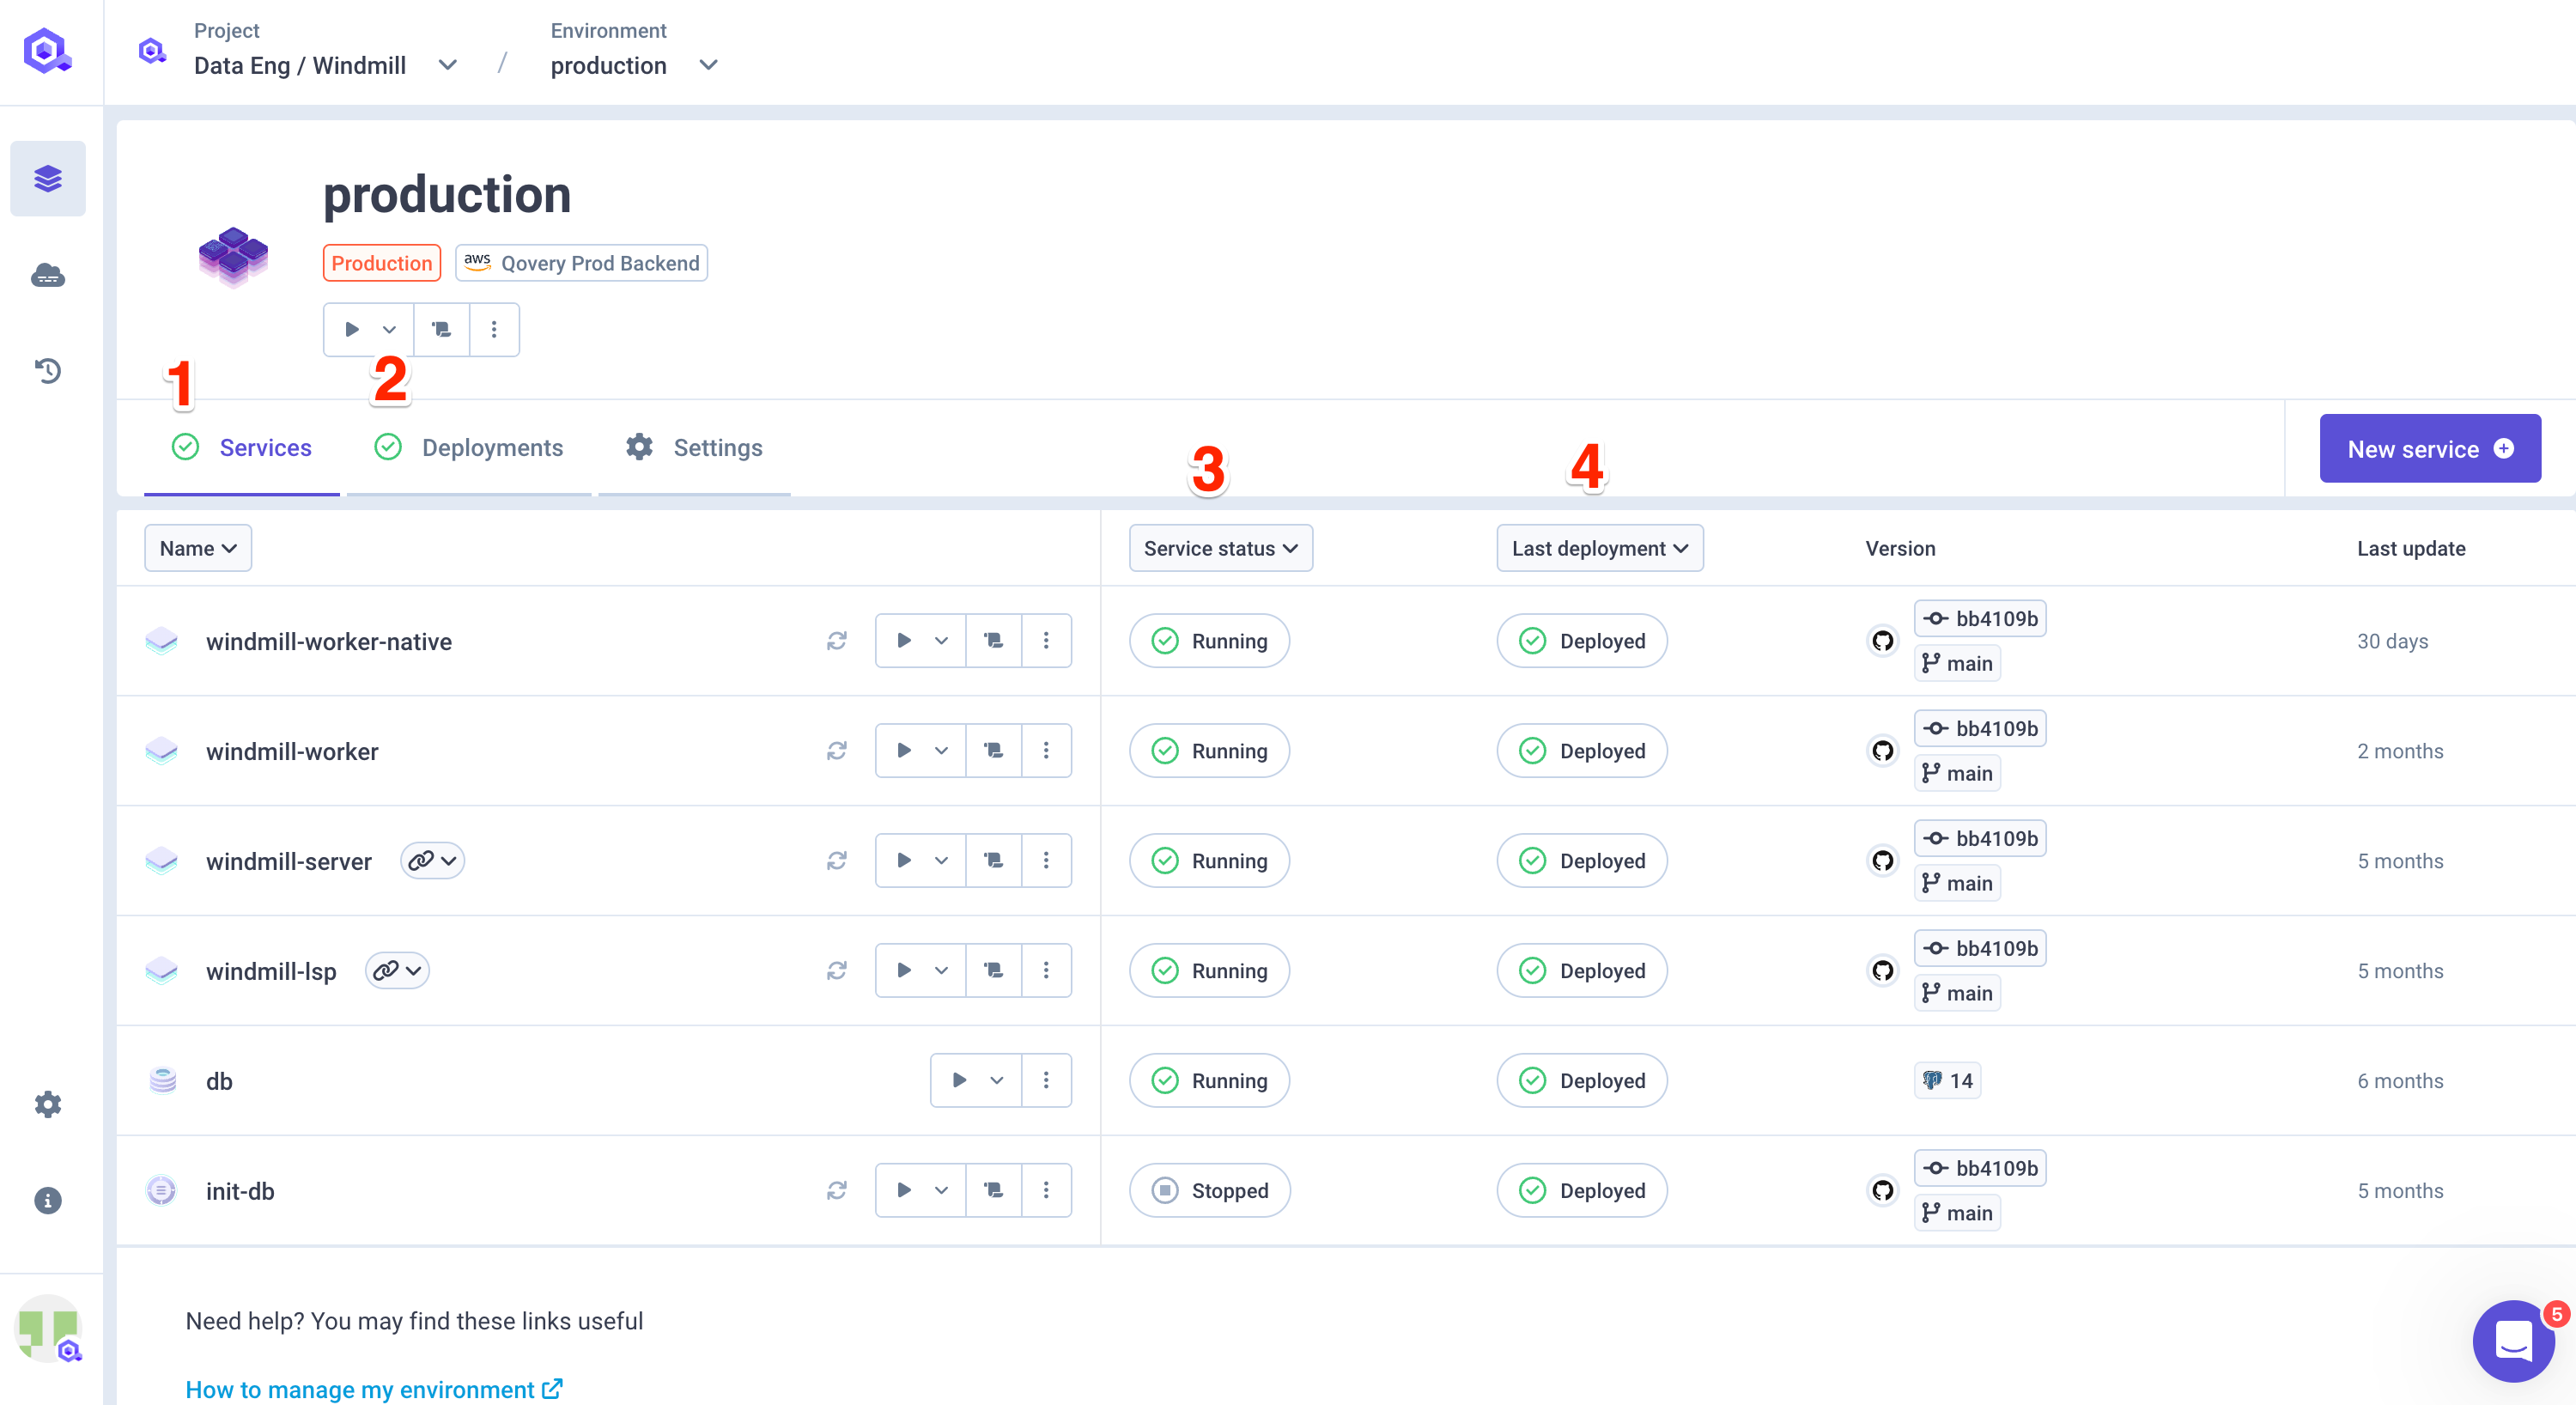
From any environment window on your Qovery Console, you can monitor the running and deployment status of your environments and services.
| Item | Description |
|---|---|
| 1 | The dot in the service tab shows the environment running status. For more information, see the Environment Statuses section below. |
| 2 | The dot in the deployment tab shows the environment deployment status. For more information, see the Deployment Statuses section below. |
| 3 | The label in the column "Service status" represents the running status of the service. For more information, see Service Statuses section below. |
| 4 | The label in the column "Last deployment" represents the status of the latest deployment of the service. For more information, see Deployment Statuses section below. |
Running Statuses
Thanks to Running statuses, you can find out which services are currently running on your platform, and which are interrupted. There are two types of run services available currently: environment statuses and service statuses.
Environment Statuses
When you access an environment on your Qovery Console, you can check its status in real-time.
The environment status is computed based on the statuses of all the services in that specific environment. Here are all the possible environment statuses:
| Status | Description |
|---|---|
| STOPPED | All the services are stopped. |
| STARTING | At least 1 service is starting. |
| STOPPING | At least 1 service is stopping. |
| RUNNING | All services are running correctly. |
| ERROR | All services are in error status. |
| WARNING | At least 1 service is in error status (but not all of them). |
Service Statuses
When you access an environment on your Qovery Console, you can check the status of each service in that environment in real-time within the column "Service status".
Here are all the possible service statuses:
| Status | Description |
|---|---|
| STOPPED | All the application instances are stopped. |
| STARTING | At least 1 application instance is starting. |
| STOPPING | At least 1 application instance is stopping. |
| RUNNING | All application instances are running correctly. For Lifecycle and Cronjob, it means that the job is executing |
| ERROR | All application instances are in error status. |
| WARNING | (Valid for multi-instance applications only) At least 1 application instance is in error status (but not all of them). |
| Completed | (Valid for Lifecycle and Cronjob only) The job was correctly executed. |
The service status is computed based on the status of each Kubernetes pod deployed for this application.
Pod status (Application instances)
You can check on the Service overview page the status of each pod running your application in Kubernetes. This page is accessible by clicking on one of the services of your environment.
Within this page you will have a view of:
- the number of running instances of your application
- the status of each instance
- in case of an error, you will get the reason behind the issue by clicking on the Pod in error.
By clicking on Logs, you will be redirected to the service logs specifically filtered for this pod.
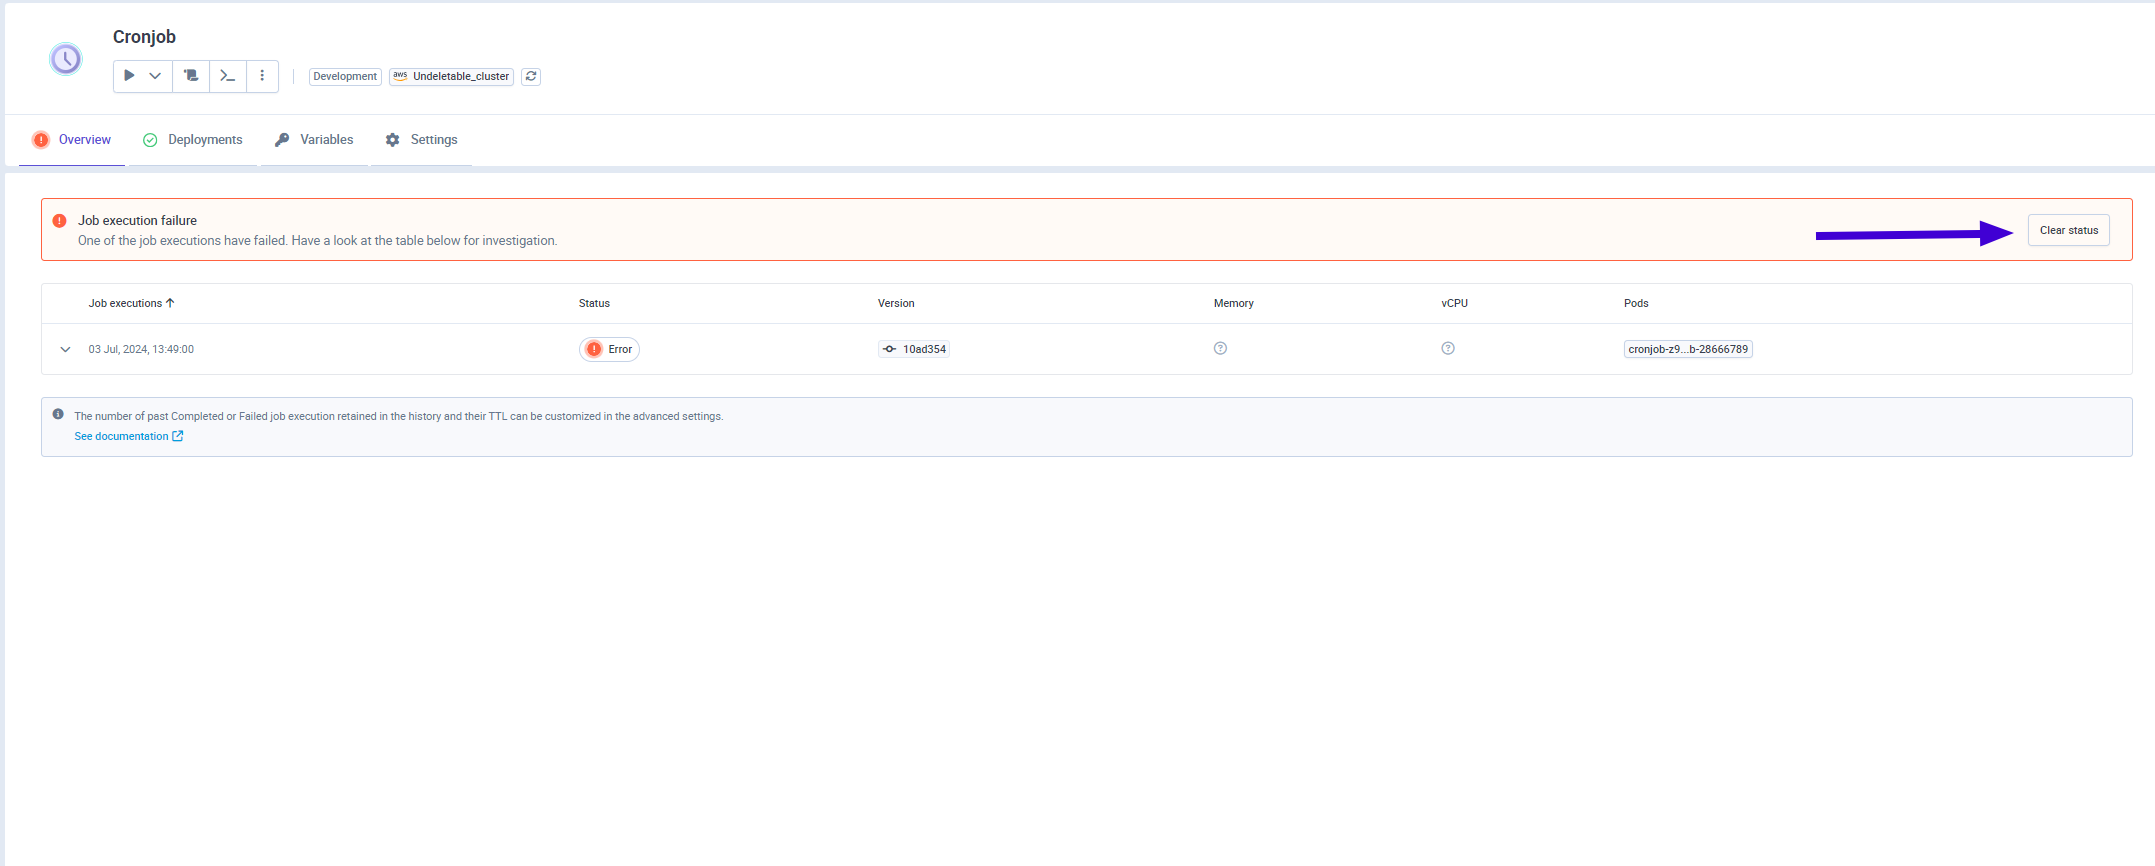
Clear old job executions
If you have old cronjobs or lifecycle jobs execution in error, your global job status will be in Warning.
You have the possibility to clear these old executions by clicking on the Clear status button in the status banner of your job.
Deployment Statuses
When you access an environment on your Qovery Console, you can check:
the overall status of your deployments in that specific environment, thanks to the dot present within the "Deployment" tab. This corresponds to the overall deployment status of your environment.
the deployment status of each service in that specific environment, thanks to the label displayed in the
Service statuscolumn. This corresponds to the status of the last deployment performed on the service.Here are all the possible deployment statuses for both environments and services:
QUEUED (temporary state).
BUILDING (temporary state).
BUILDING ERROR (final state).
DEPLOYING (temporary state).
DEPLOYMENT ERROR (final state).
CANCELLING BUILDING (temporary state).
CANCELLED (temporary state).
DEPLOYMENT OK (final state).