Services logs
In addition to real-time monitoring, Qovery observability includes logs to help you understand what happened in your applications.
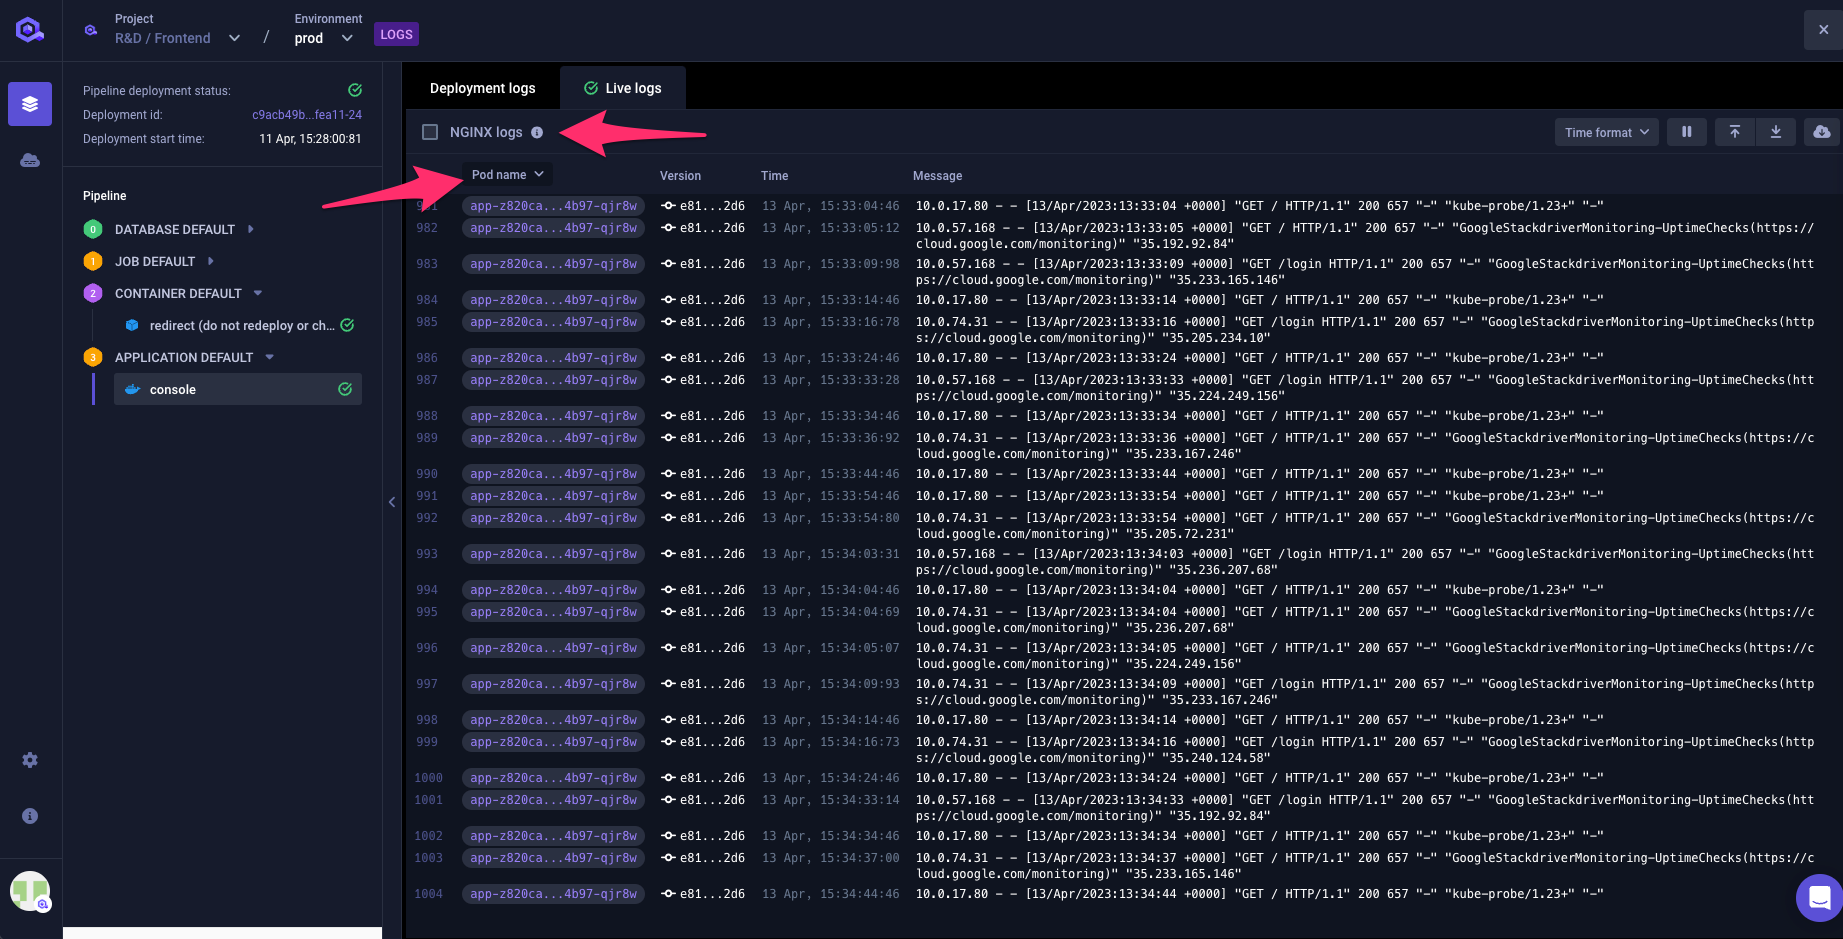
Service Logs
Every service in Qovery has its own log stream, collected and stored via Loki + Promtail. (See the Logs Section to know more)
- Full historical access: Complete log history with 12 weeks retention when observability is enabled, or 24 hours without it
- Logs are enriched with Qovery-specific labels such as service ID and environment ID for easier filtering
- Error-level logs are automatically detected and counted, making it easy to correlate metrics with log spikes
Log Navigation
From the Monitoring tab:
- You can quickly spot if error logs occurred within the selected time range
- Click on the scroll icon next to the error logs to jump into the Service Logs view
- The logs interface will already be filtered on the right service, severity, and selected time range
Advanced Log Filtering
Qovery provides powerful filtering capabilities to help you find and investigate specific issues in your service logs:
- Search by keyword: Search for specific messages within your logs to quickly locate relevant entries
- Filter by time range: Narrow down logs to specific time periods to isolate deployments or incidents
- Filter by log level: Filter logs by severity level (error, info, debug, etc.) to prioritize important entries and focus on critical issues
These filtering tools enable you to efficiently investigate errors, trace regressions, and review deployment behavior without leaving the Qovery platform. Combined with the 12-week retention period (when observability is enabled), you have complete visibility into your application's historical behavior.