Monitoring services
Once observability is enabled, go to the Monitoring tab at the service level in the Qovery console.
This tab gives you real-time and historical visibility into your applications.
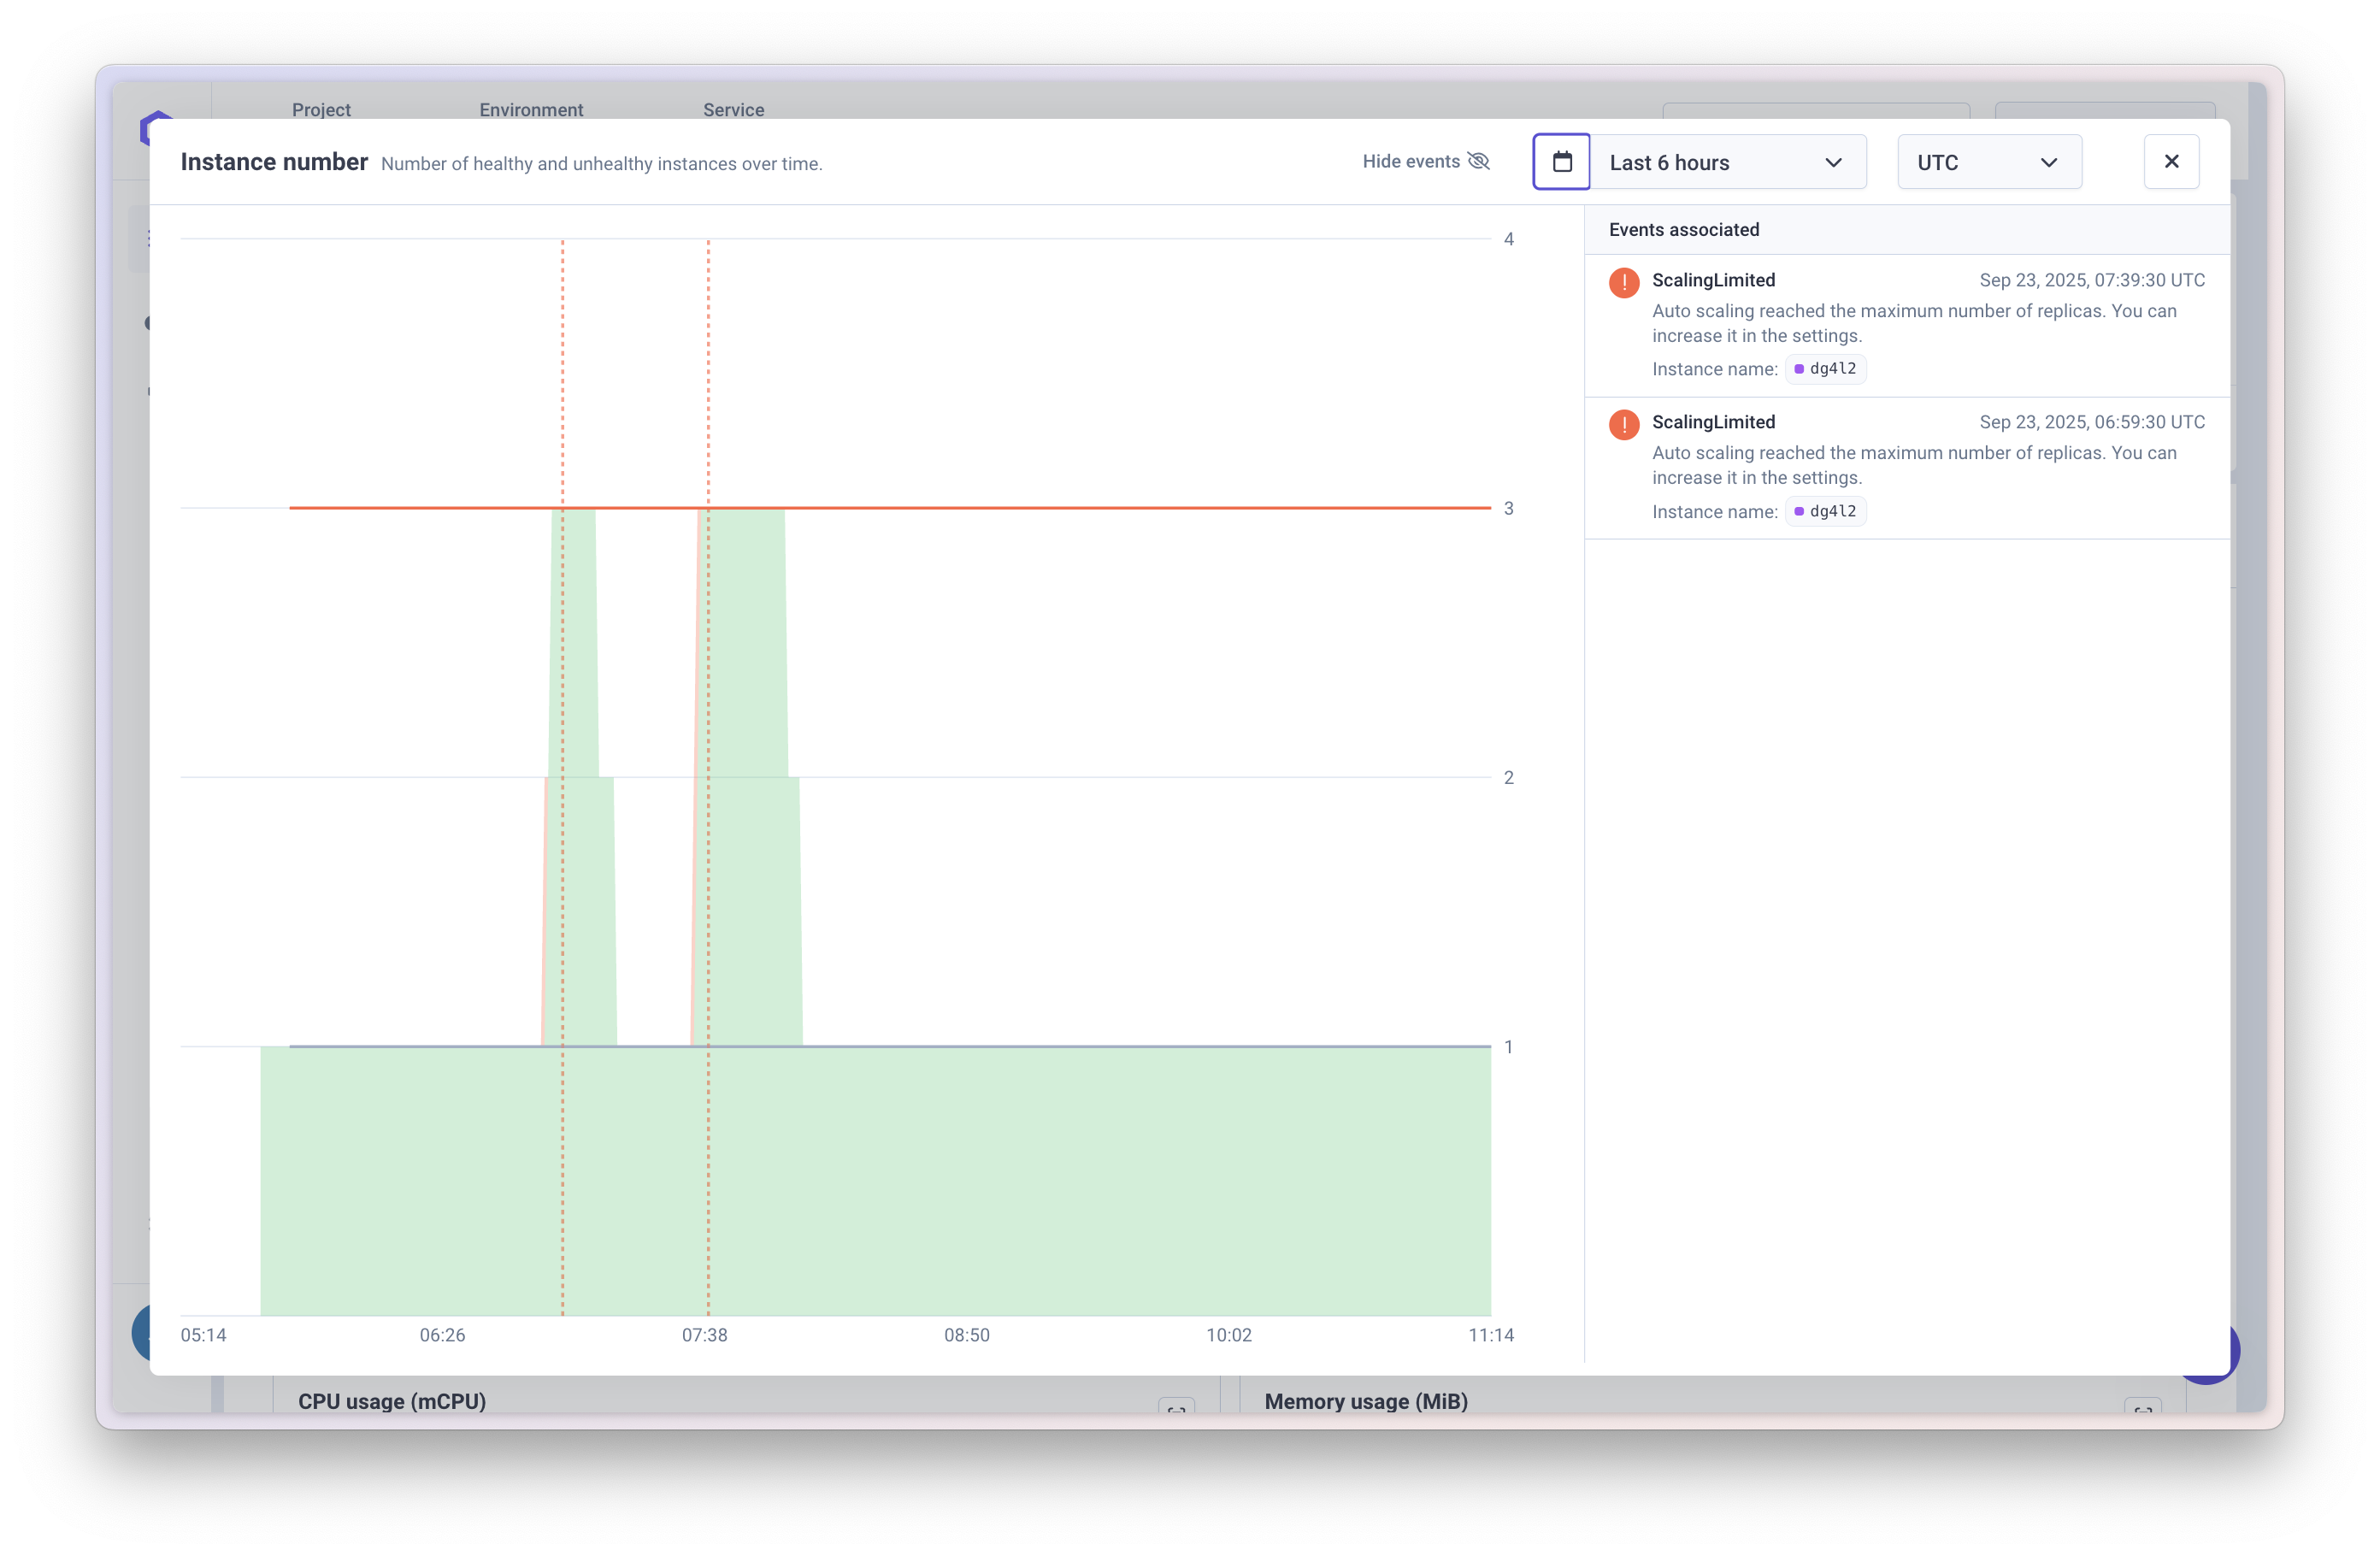
Service Health
The Service Health Check provides an overview of running instances and recent events:
- Qovery events (e.g. deployments, failed deployments) and Kubernetes events (e.g. autoscaler triggered, OOMKilled pod, health check failures).
- Log errors counter – automatically counts error-level logs. You can jump directly into logs at the exact point where errors occurred.
- HTTP error rate (499 and 5xx errors) – aggregated over all requests, with the ability to expand and view the breakdown by endpoint and status code.
- Network request duration (P99) – shows tail latency of your requests, expandable to include P90 and P50.
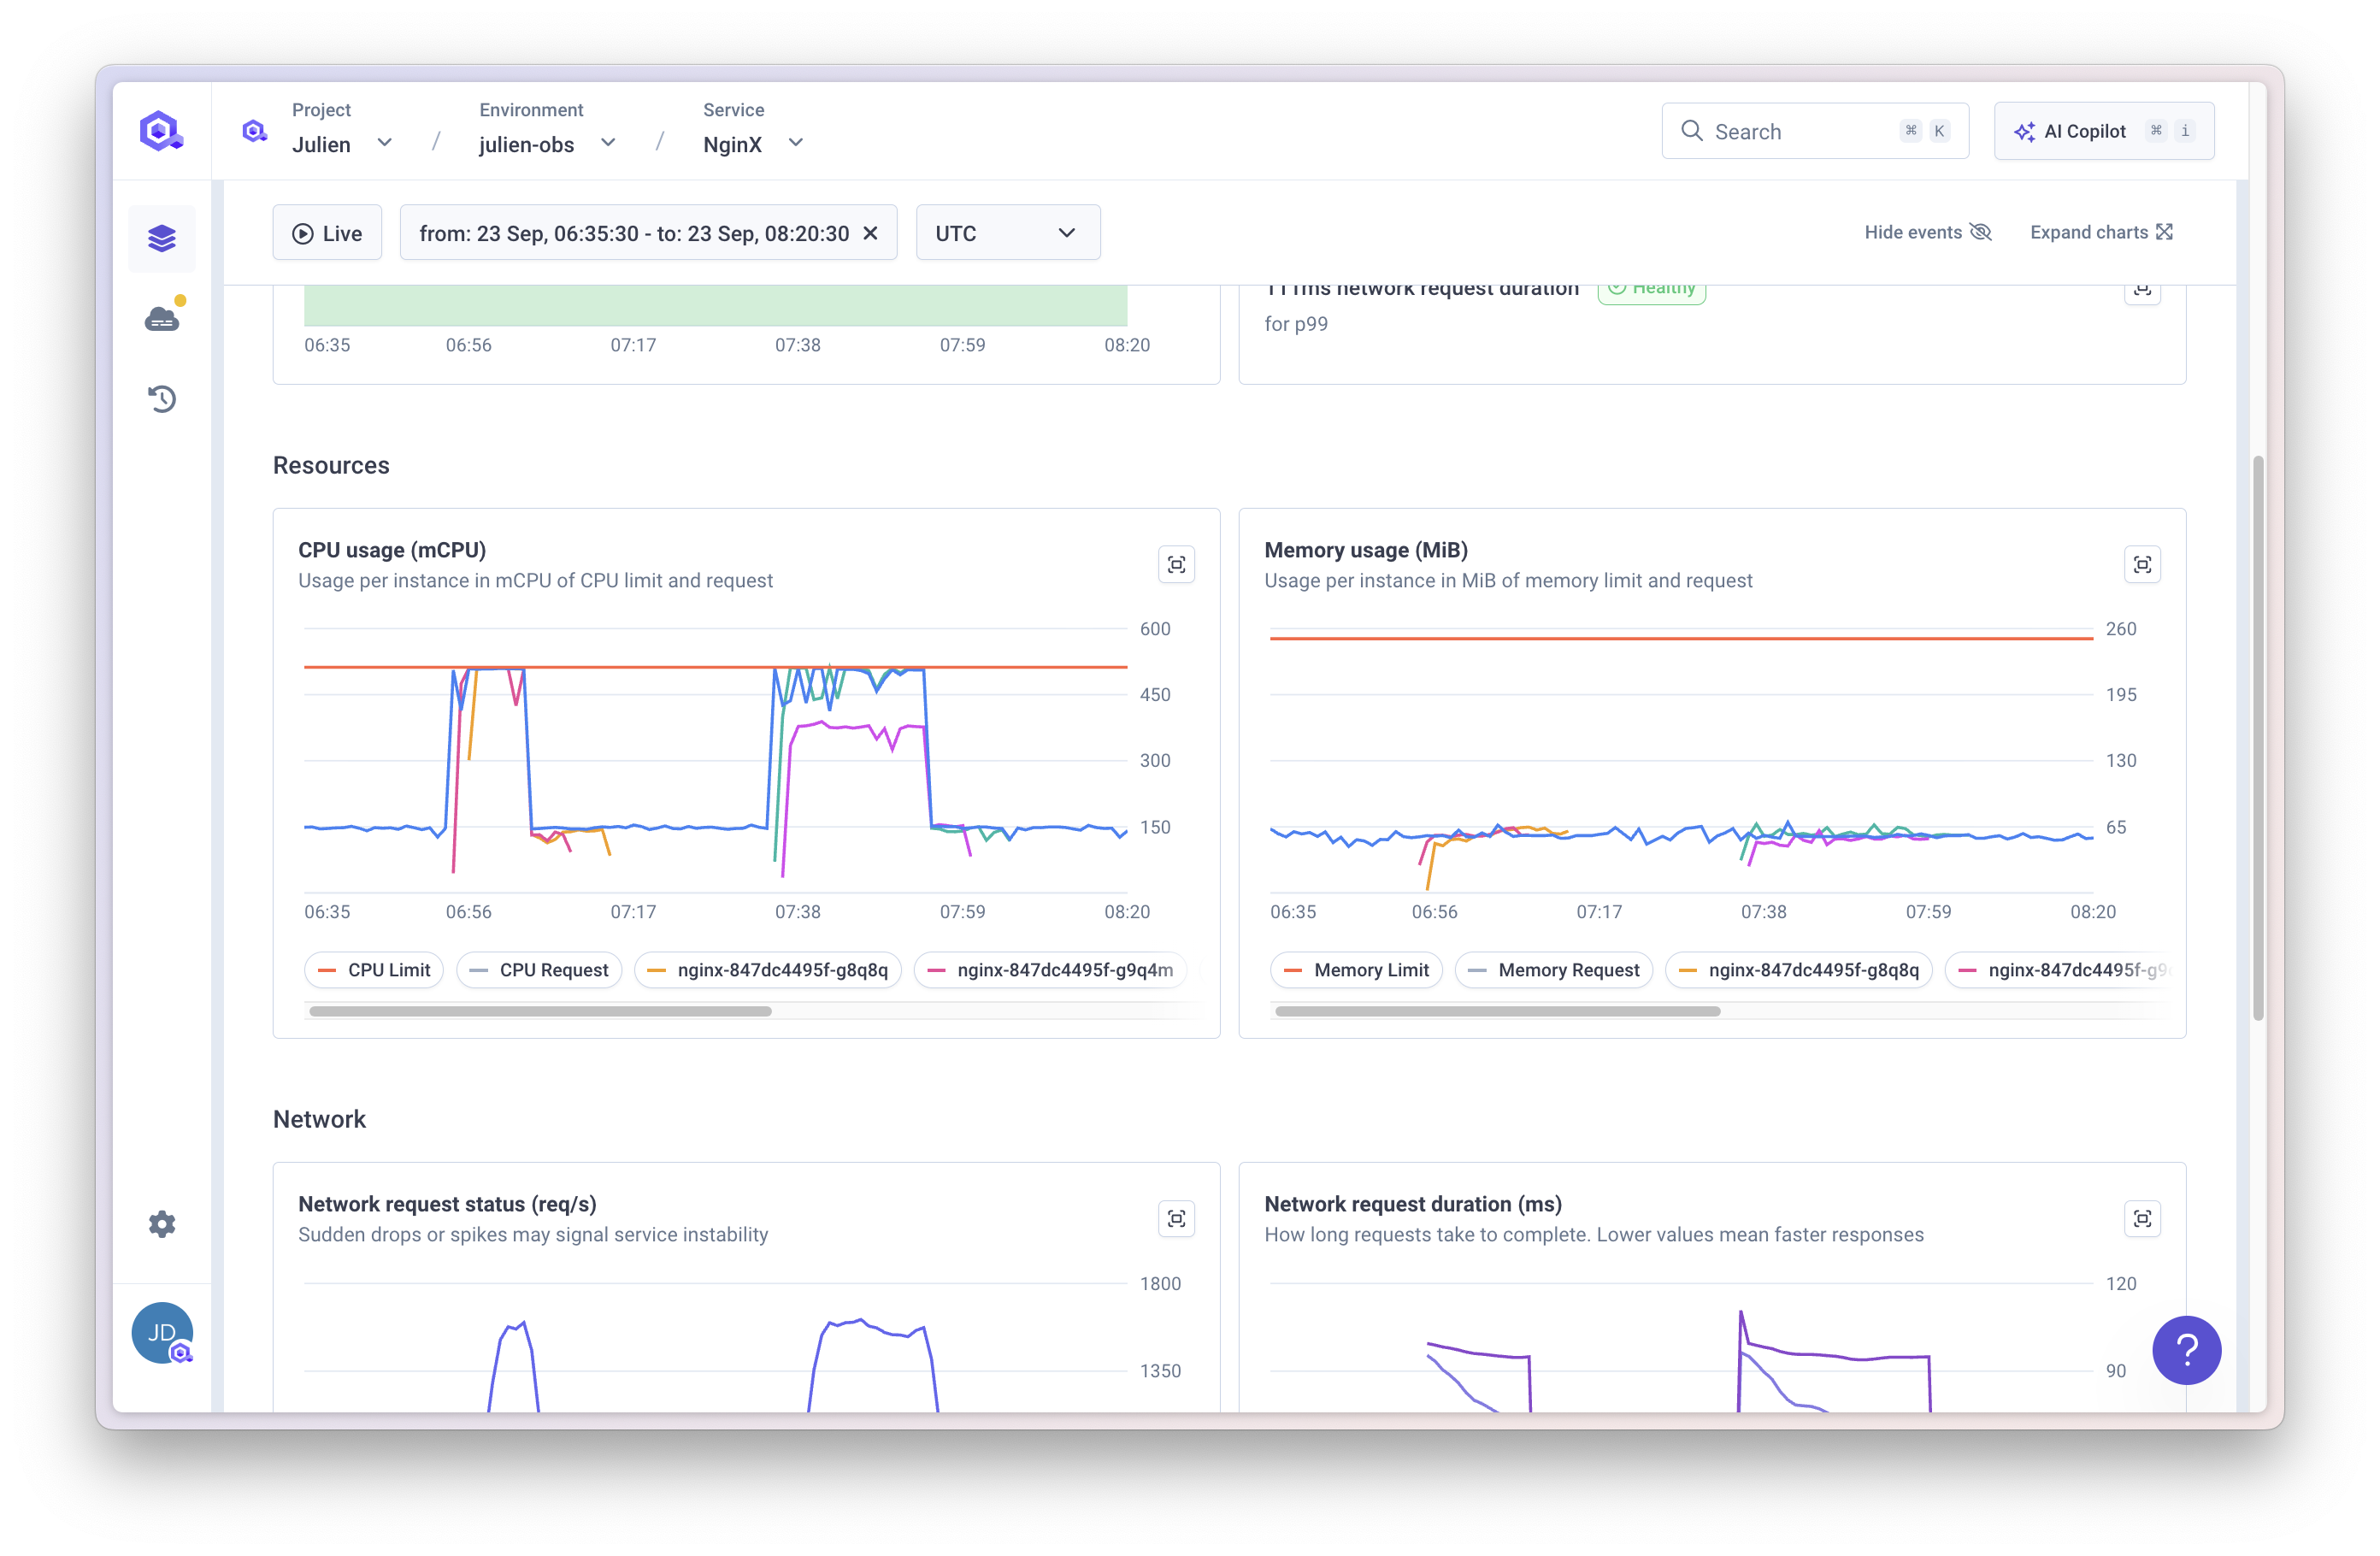
Resources
Resource usage is tracked per pod:
- CPU usage – compared against your request and limit.
- Memory usage – compared against your request and limit.
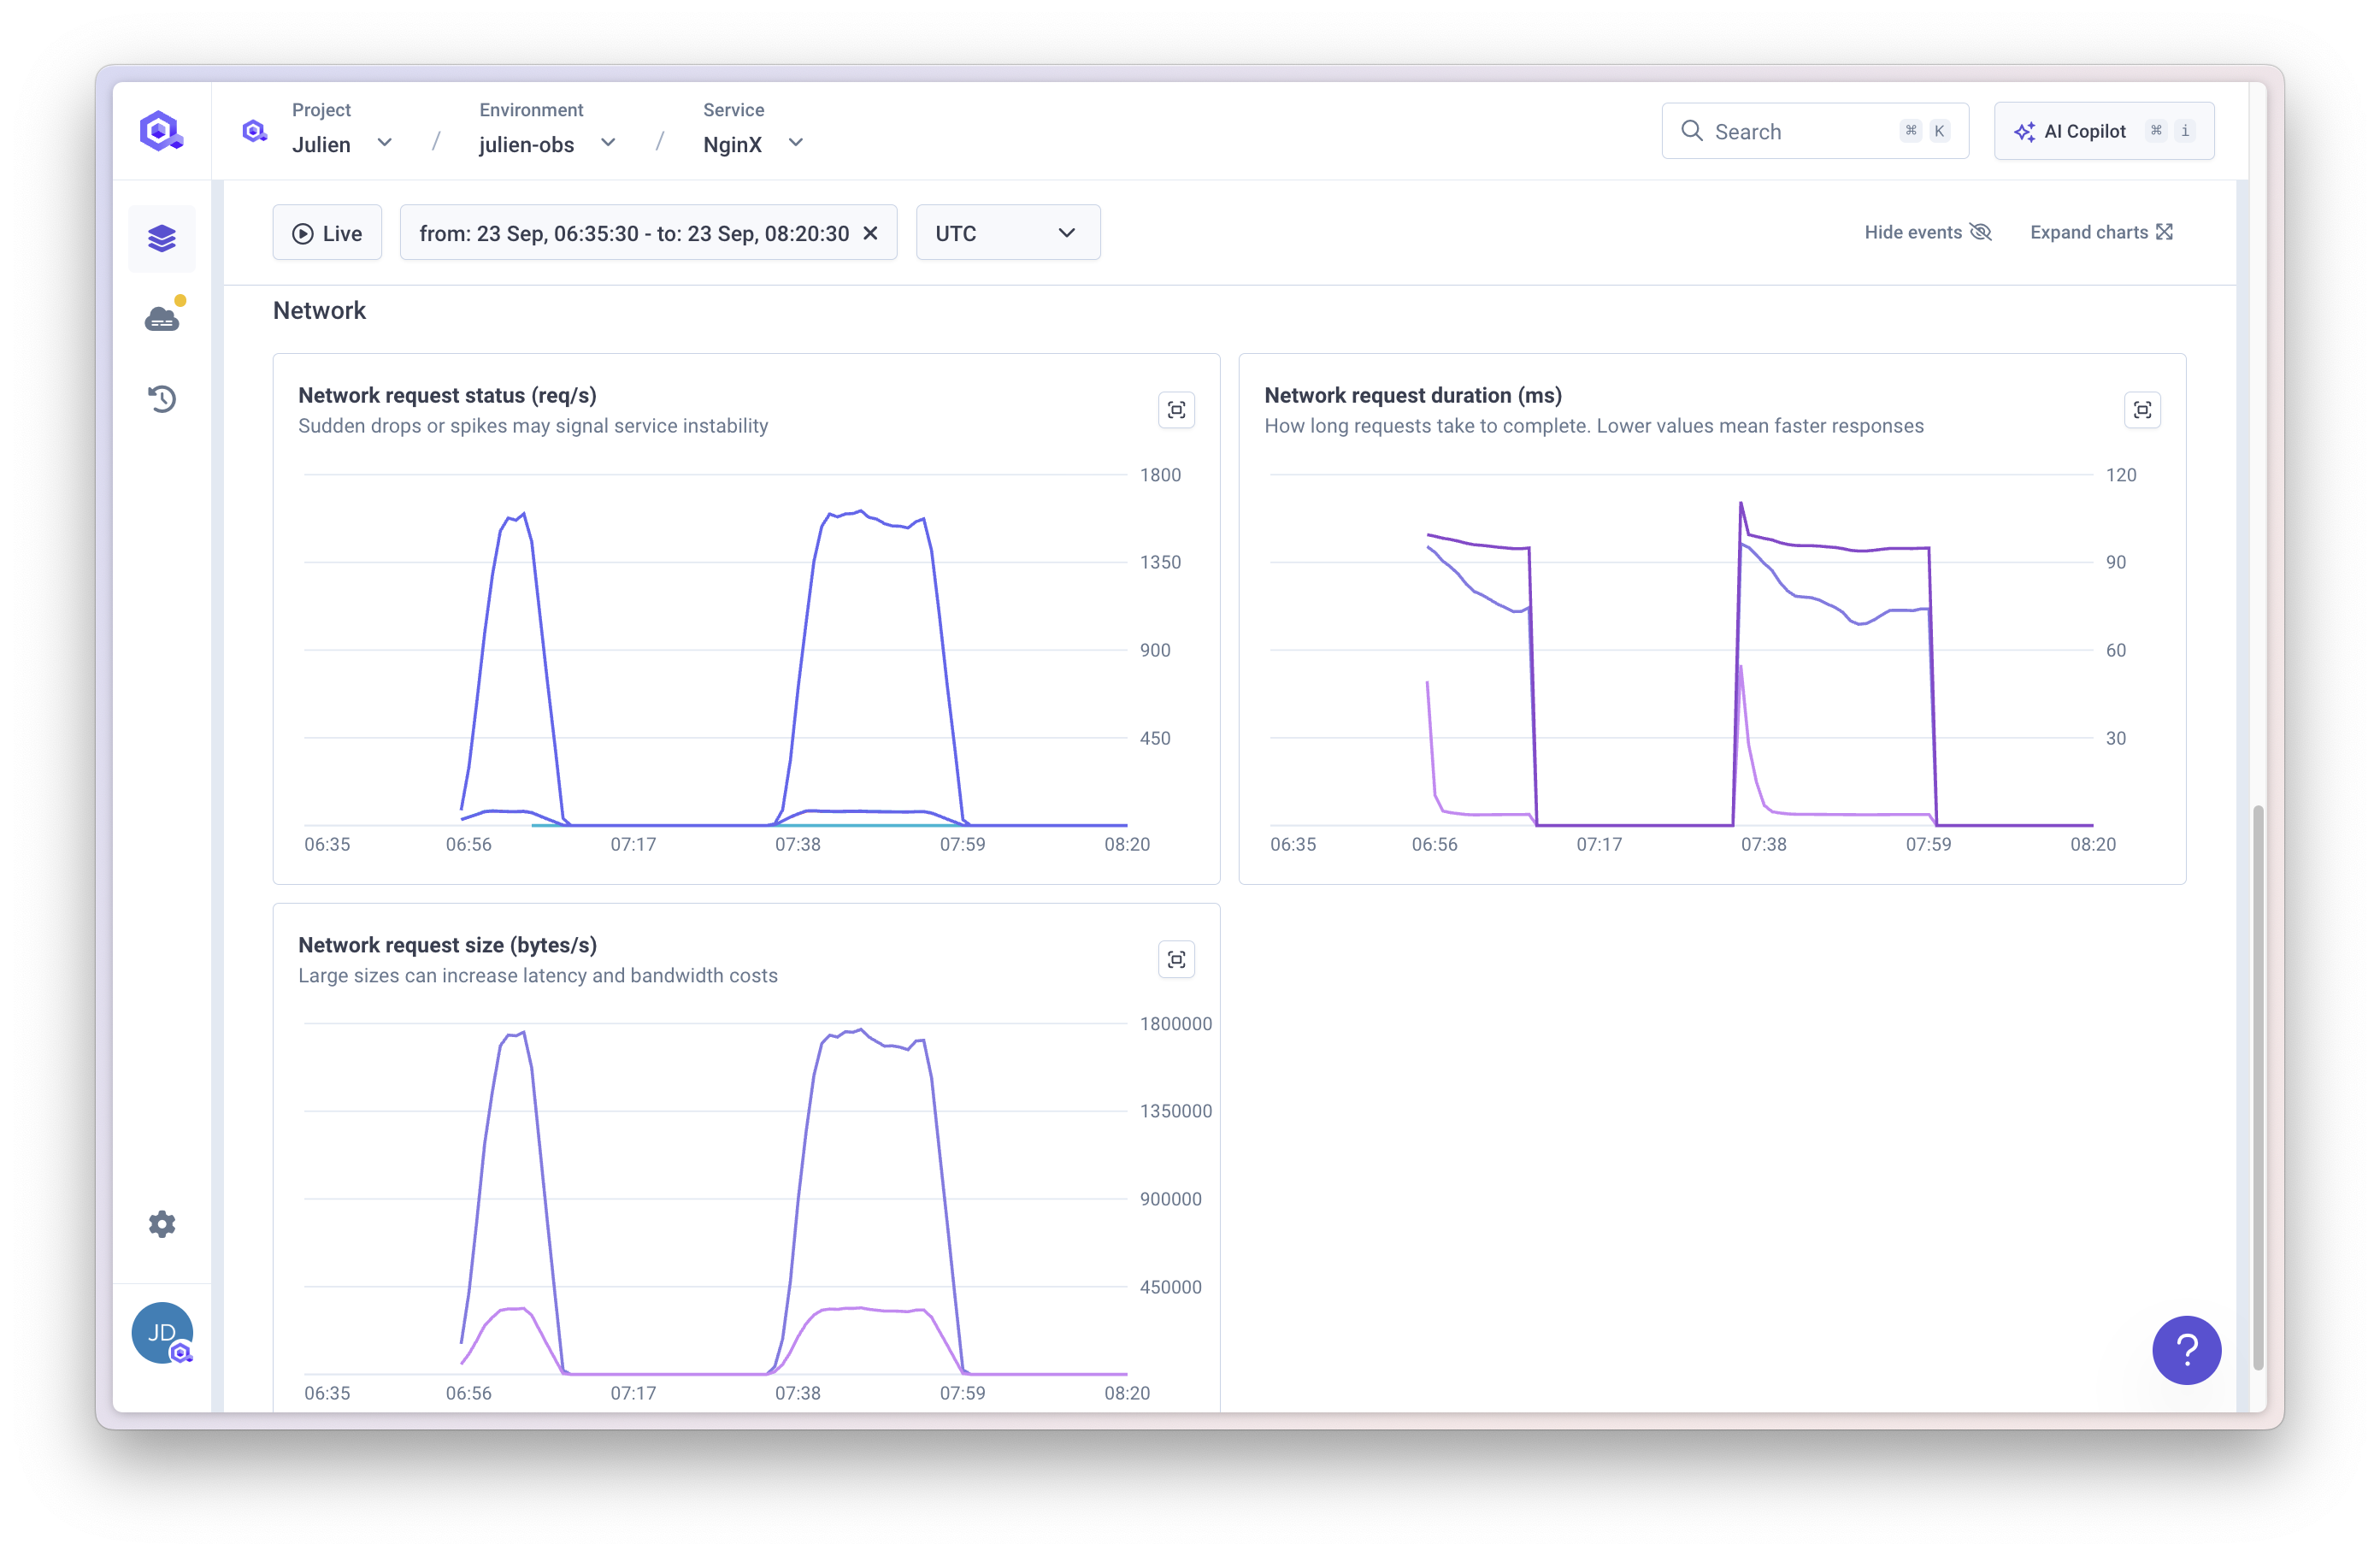
Network
Qovery provides network-level observability:
- Request status by path and error code.
- Request duration with percentiles (P50, P95, P99).
- Request size statistics.
If your application exposes a public port, metrics represent ingress traffic. If no public port is exposed, metrics represent internal traffic within the cluster.
Controls
- Live update: toggle continuous refresh of charts.
- Custom time frame: select the time range of data to display.