Observability architecture
Qovery observability is powered by a combination of open-source tools and the Qovery platform.
Data Collection
The observability stack uses specialized components to gather metrics, logs, and events from your Kubernetes infrastructure. By default, data is retained for 30 days.
- Prometheus + Thanos – collect and store metrics (CPU, memory, network). Each cluster runs its own Prometheus instance with Thanos providing long-term storage in cloud object storage (S3/GCS).
- Loki + Promtail – collect and store container logs. Promtail runs as a DaemonSet collecting logs from all containers, while Loki stores them with 12 weeks retention and advanced querying capabilities.
- Qovery Event Logger – captures Kubernetes events and enriches them as logs and metrics. A custom fork of the Kubernetes event logger pushes events to both Prometheus (for alerting) and Loki (for traceability).
Data Flow
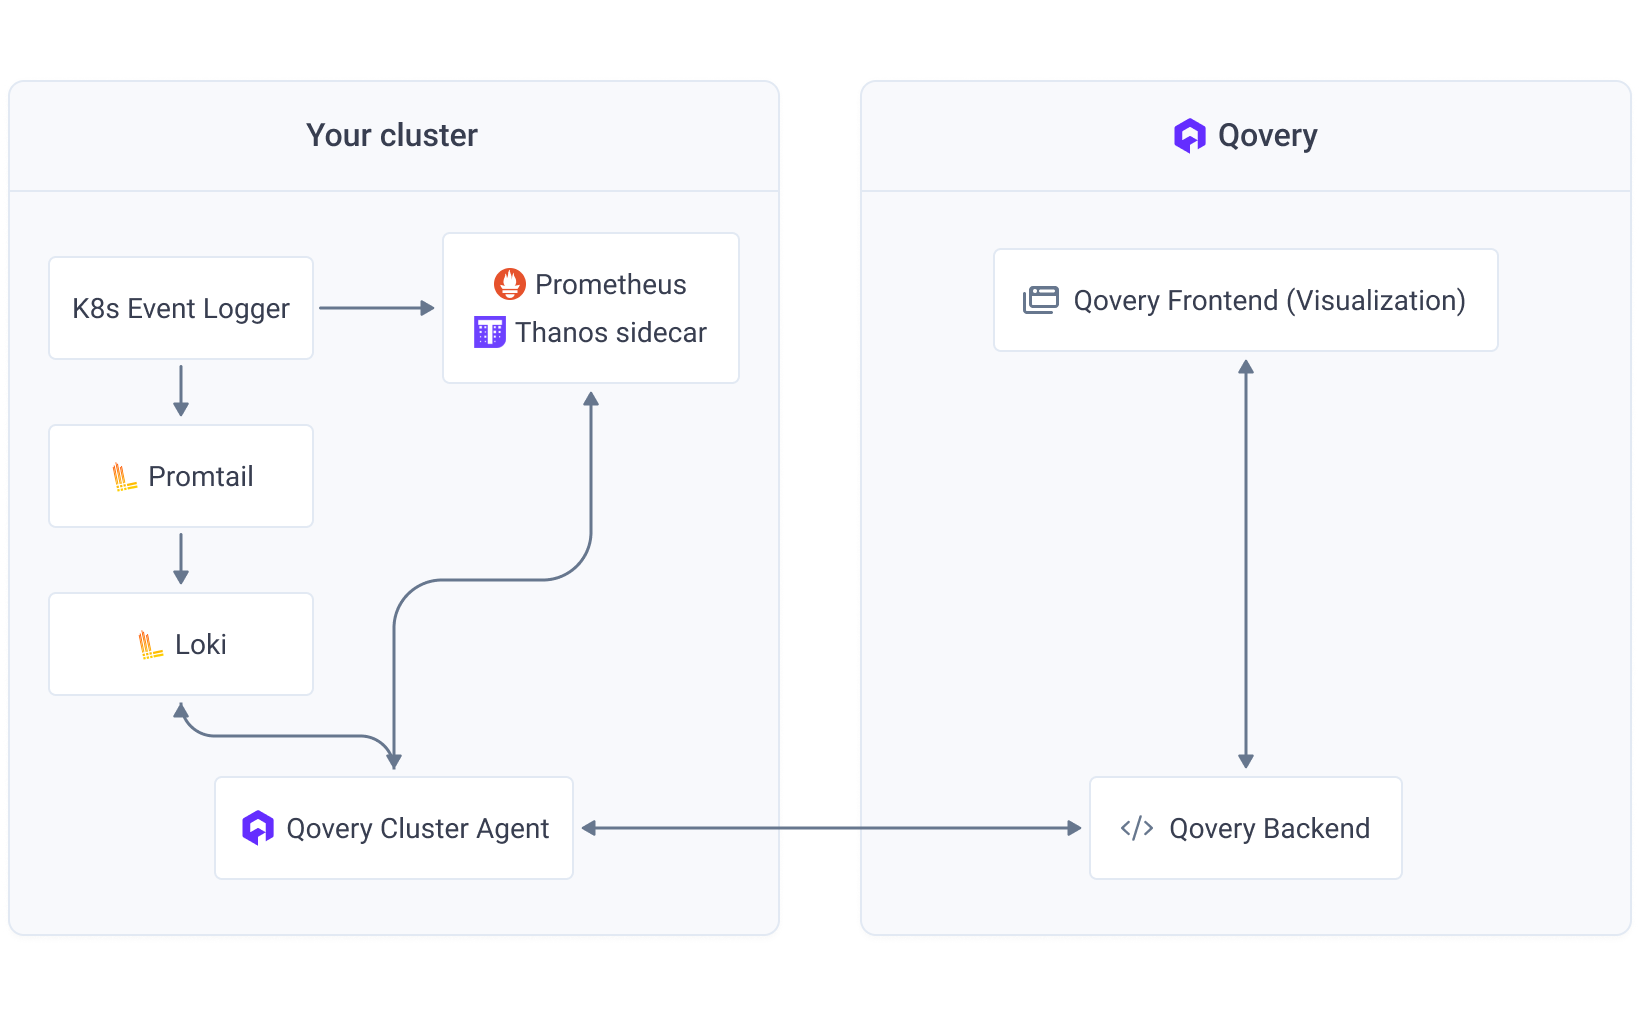
This pipeline ensures reliable collection, processing, and delivery of observability data from your clusters to the Qovery platform.
- Prometheus scrapes metrics from Kubernetes and workloads every 30 seconds with automatic service discovery.
- Thanos provides persistence and long-term storage with intelligent data compaction and retention policies.
- Promtail collects logs from containers and forwards them to Loki with custom pipeline stages that normalize log levels and detect errors automatically.
- Qovery Cluster Agent exposes metrics and logs to the Qovery backend via secure gRPC, enriching data with Qovery-specific labels (service ID, environment ID).
- The Qovery frontend queries this data and displays it in your dashboard using Recharts for time-series visualization, with React-Query handling caching and real-time updates.
Key Features
- Per-cluster Architecture: Each cluster maintains its own observability stack for data isolation and performance.
- Custom Log Processing: Automatic error detection and classification with custom metrics (q_log_errors_total) for alerting.
- High Availability: Prometheus runs with 2 replicas, Thanos components auto-scale (2-5 replicas) based on load.
The Qovery platform implements an intelligent retention strategy that balances observability needs with storage costs. This multi-tiered approach ensures maximum granularity for recent debugging while preserving historical trends for long-term analysis.
The system uses a progressive compaction approach: recent data is stored at native resolution to enable precise troubleshooting, then gradually aggregated over time to optimize storage space while preserving essential information for performance analysis and capacity planning.
- Smart Retention:
- Prometheus: 7 days local retention
- Thanos:
- Raw metrics (15 days): Original data collected at native frequency (scraping set to 30s)
- 5m resolution (30 days): Metrics aggregated in 5-minute blocks to reduce volume (used for short timerange)
- 1h resolution (30 days): Metrics aggregated in 1-hour blocks for optimized long-term storage (used for long timerange)
- Loki: 12 weeks log retention