Observability overview
Qovery provides built-in observability to help you monitor, analyze, and troubleshoot your applications and infrastructure.
With observability enabled, you gain deep visibility into the health, performance, and behavior of your services directly from the Qovery console.
How to access this feature?
Currently this feature is not in self-service, if you’d like to get access to this feature, please reach out to us by contacting us on Slack.
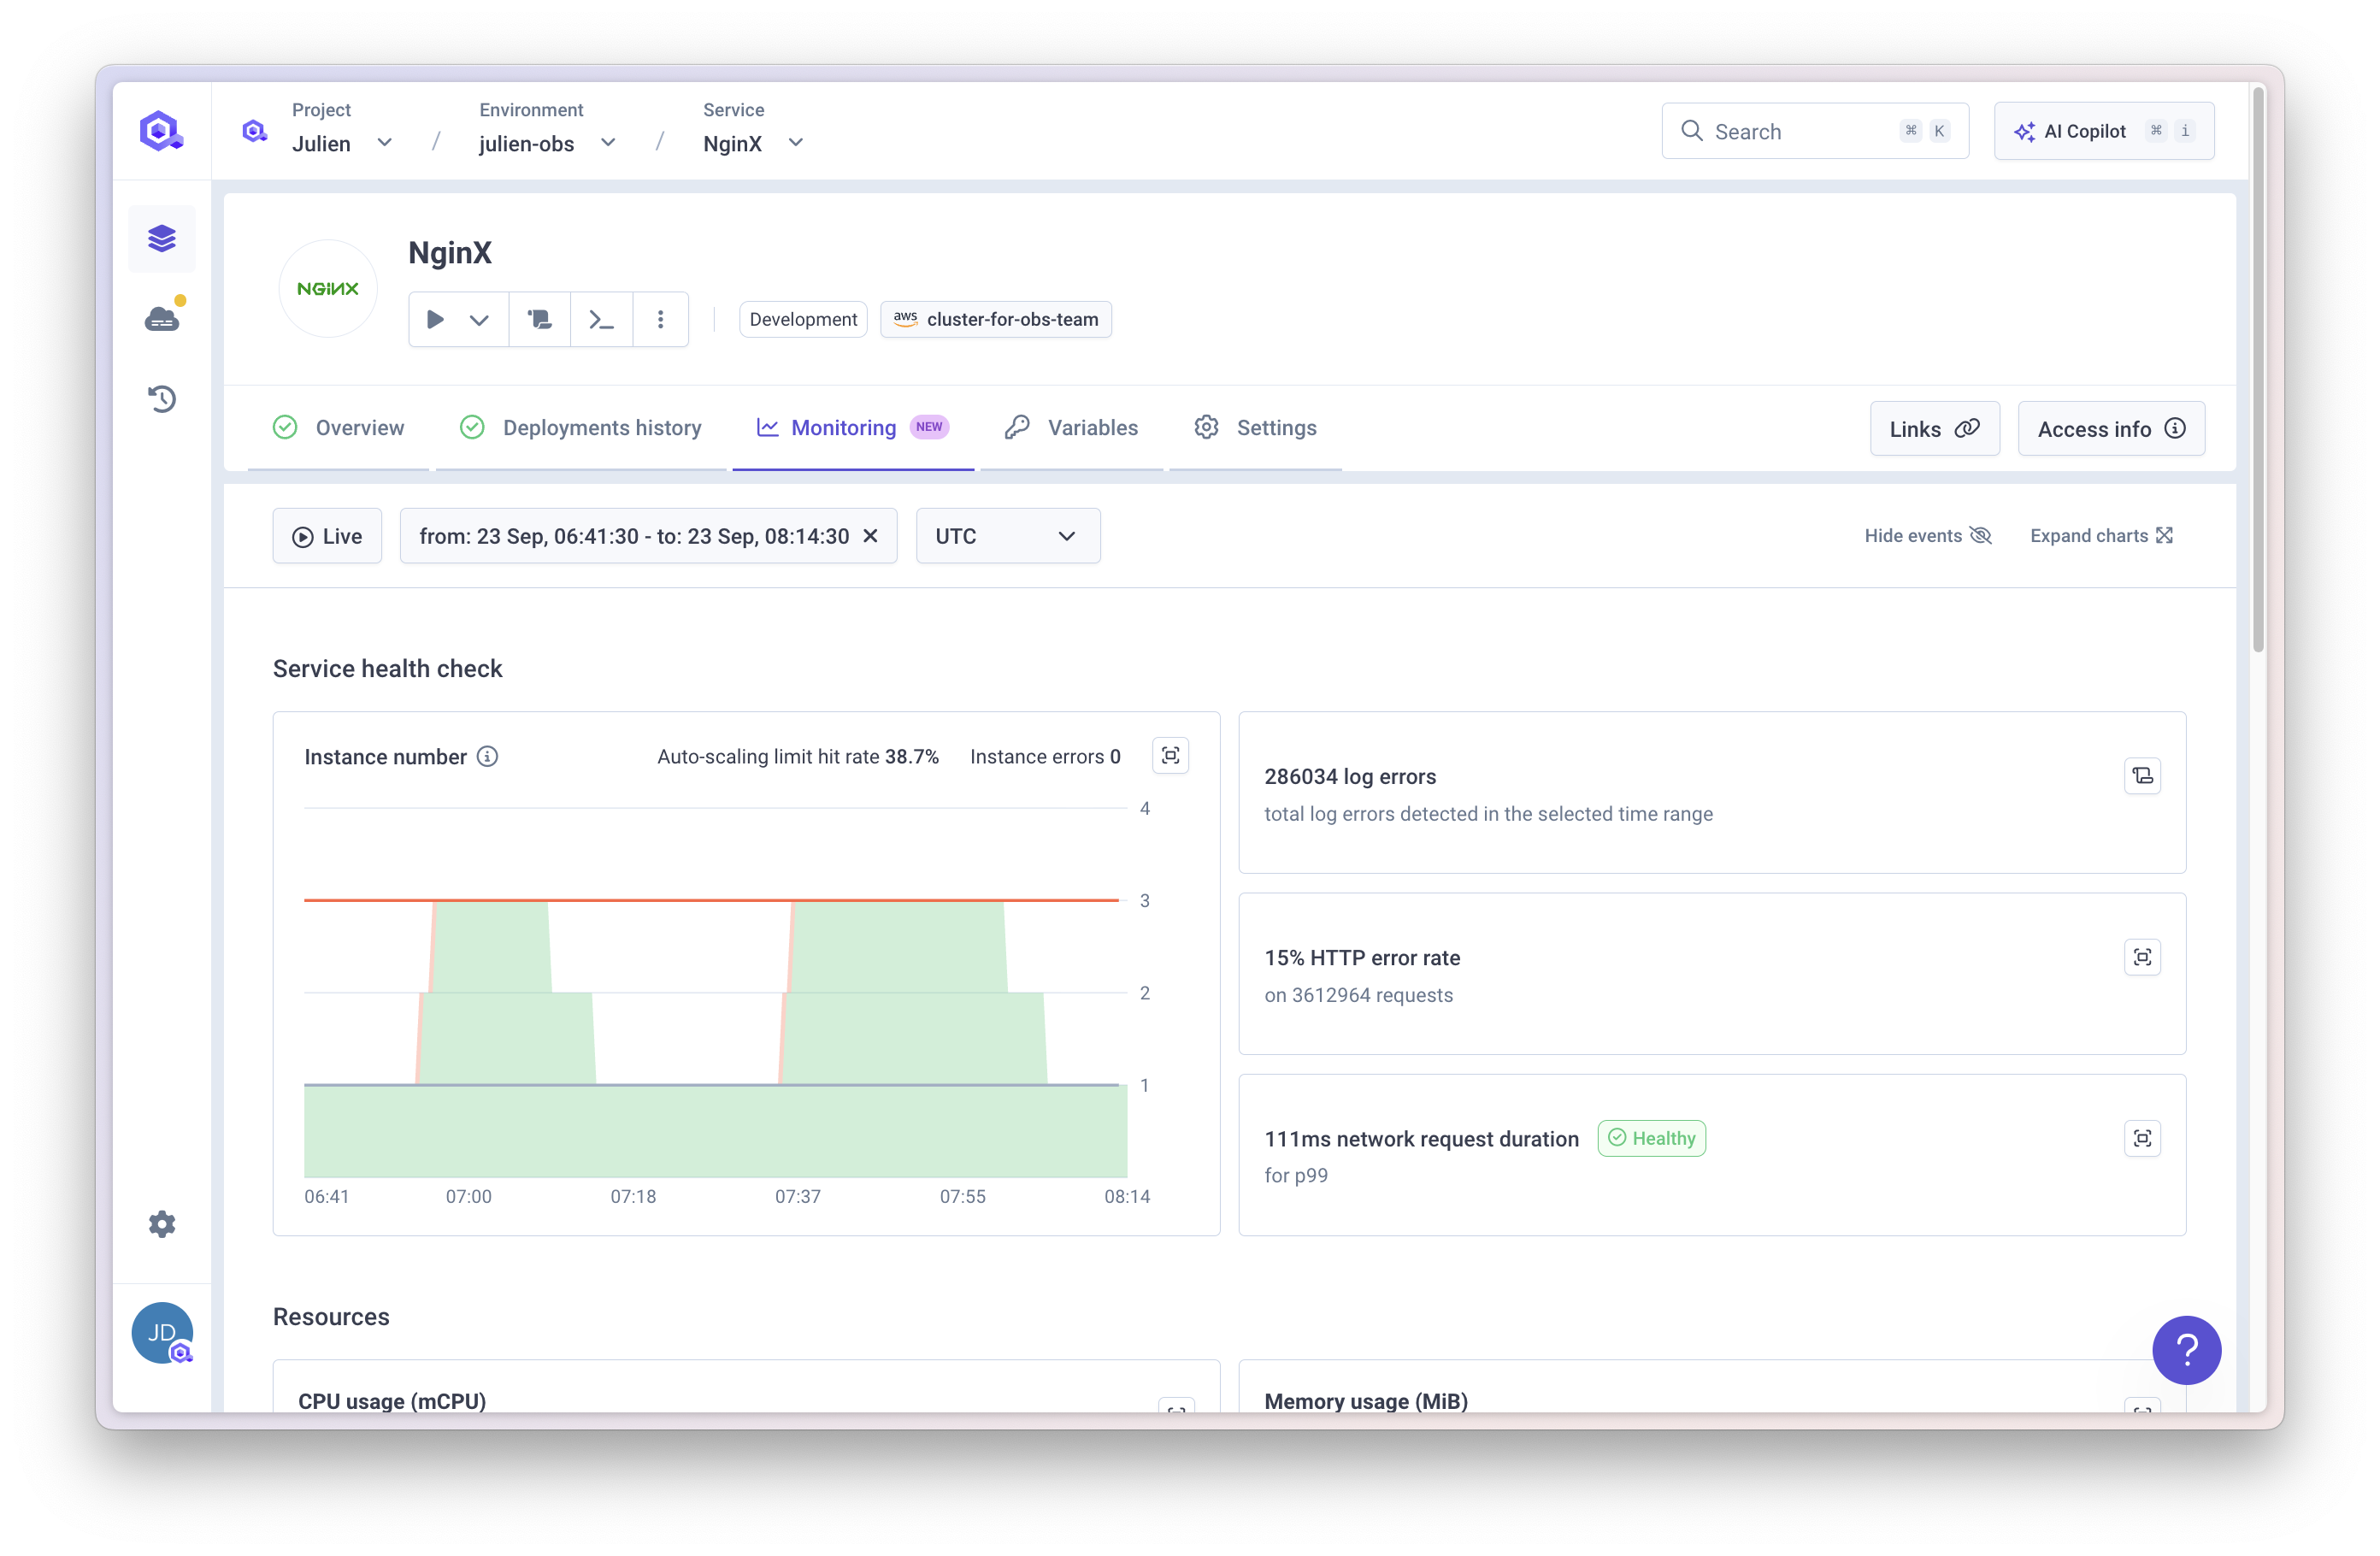
What is included?
- Service health checks to understand how your applications behave in real time.
- Metrics such as CPU, memory, and network usage per service.
- Logs with up to 90 days of retention for troubleshooting.
- Events from both Qovery and Kubernetes (e.g. deployments, scaling events, pod failures).
Observability helps you answer key questions such as:
- Is my service healthy?
- Why is my application consuming more resources than expected?
- What errors occurred during deployment or runtime?
- How do requests behave over time (latency, error rates, throughput)?
Why Choose Qovery’s Built-in Observability
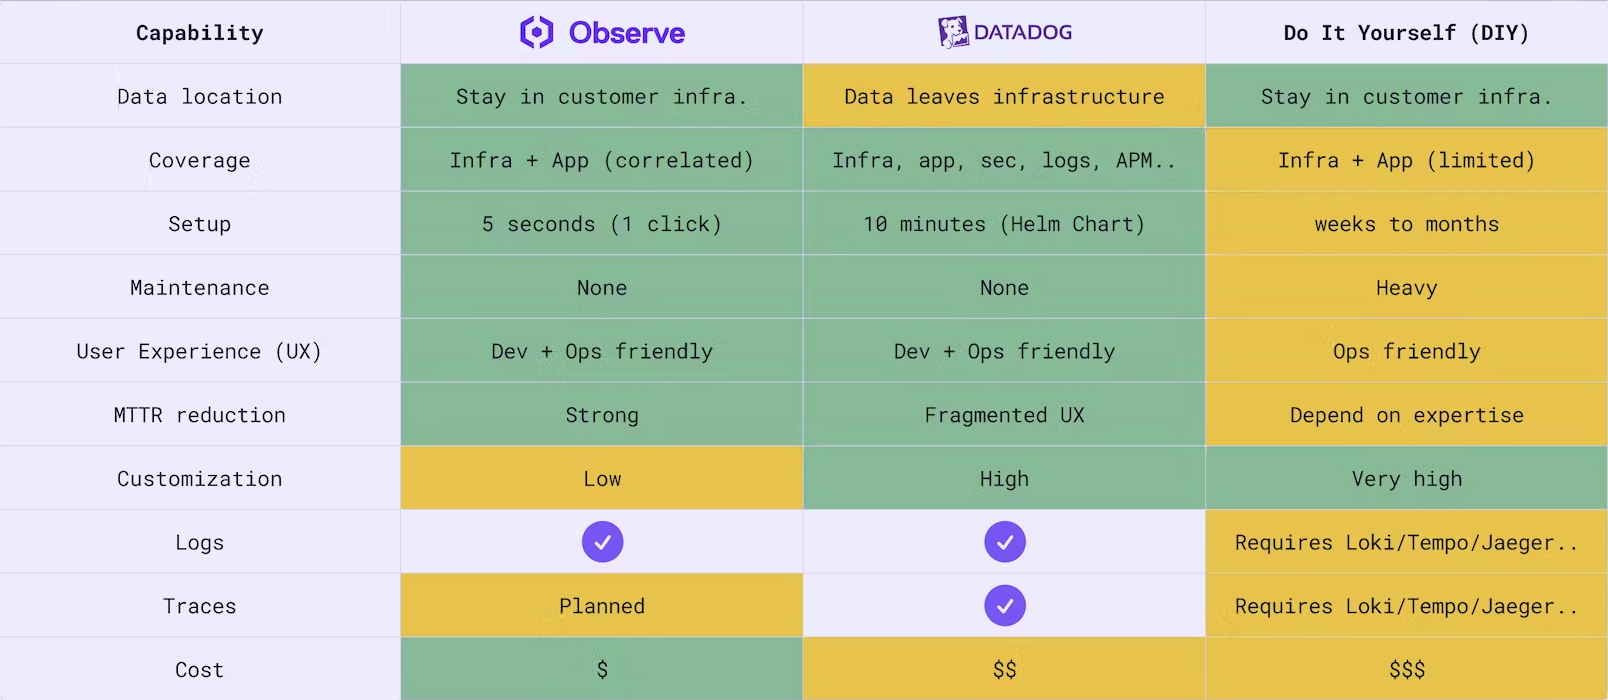
Today, engineering teams face three main options when it comes to observability:
Third-party SaaS tools (e.g. Datadog)
SaaS monitoring platforms are powerful and feature-rich, but they come with two significant drawbacks:
- Data leaves your infrastructure, which may raise compliance, security, or cost concerns.
- Weak correlation with your deployed services on Qovery. You end up switching contexts between your deployment platform and your monitoring tool, making troubleshooting slower and more complex.
Do-it-yourself (DIY) stack
You can build and maintain your own observability stack (Prometheus, Grafana, Loki, Tempo, Jaeger…). This offers flexibility, but it requires:
- Dedicated expertise to set up and operate.
- Heavy ongoing maintenance of upgrades, scaling, storage, and integrations.
- High customization overhead before you get something usable across your environments.
Qovery Built-in Observability
With Qovery, you get the best of both worlds:
- Data stays in your infrastructure for compliance and security.
- Zero maintenance — we manage the observability stack for you.
- Correlated metrics and logs, directly linked to your deployed services, clusters, and environments.
- Developer + Ops friendly UX, so your team can quickly identify and resolve issues without juggling multiple tools.
For more details, refer to the documentation below: